

Full Length Research Article
Exploring the Sequence analysis of the Two-Component System Response Regulator OmpR in Multi-Drug Resistant (MDR) Acinetobacter baumannii
Israa Radwan Ali1*, Duaa Mohammed Abdulsatar2, Ruqaia Sabbar Salman2, Anfal Mohammed Khudhair2
Adv. life sci., vol. 11, no. 3, pp. 689-695, August 2024
*– Corresponding Author: Israa Radwan Ali (israaradwanali@uomustansiriyah.edu.iq)
Authors' Affiliations
2. Microbiology Department, College of Medicine, Al-Iraqia University – Iraq
[Date Received: 21/03/2024; Date Revised: 29/06/2024; Date Published: 10/07/2024]
Editorial Expression of Concern:
18 May 2025: Following publication of this paper, the internal audit (consequent to concerns on quality raised by Web of Science) notified Advancements in Life Sciences about problems in use of English language. By this Editorial Expression of Concern, we alert the scientific community as we address the errors.
Editorial Note:
31 May 2025: You are viewing the latest version of this article having minor corrections related to the use of English language. Expression of concern is hereby revoked.
Abstract![]()
Introduction
Methods
Results
Discussion
References
Abstract
Background: The study focuses on the clinical profiles, antibiotic susceptibility, and genetic characteristics of 25 A. baumannii isolates from patients with urinary tract infections (UTIs). Patient Cohort: Ages range from 18 to 70 years, with a male to female ratio of 1.375. Notable Finding: Some multidrug-resistant (MDR) isolates had commonalities with extensively drug-resistant (XDR) variations, showing the evolution of drug resistance.
Methods: Analysis of Antibiotic Efficacy: Evaluation of antibiotic efficacy when the variable moved from lower (Bin 1) to higher (Bin 2) levels. Correlation Matrix: An analysis of antibiotic correlations to better identify potential cross-resistance and shared characteristics. Genetic Diversity Analysis: An examination of variants in the OmpR gene, including mutations and polymorphisms. Sequence Analysis is used to identify point mutations in OmpR, with an emphasis on transitions such as adenine (A) to guanine (G).
Results: Significant improvement in antibiotic efficacy from Bin 1 to Bin 2. Correlation Findings: Antibiotics have complex interactions, which may indicate cross-resistance. Genetic diversity: Variations in the OmpR gene have implications for virulence and adaptability. Sequence Analysis: The majority of point mutations in OmpR were transitions, with A typically changing to G.
Conclusion: In Iraq, the initial evidence has been found that clinical resistance in A. baumannii is possibly brought about through structural changes in the OmpR gene. Genetic diversity in A. baumannii isolates at specific sites implies potential implications in virulence and adaptation.
Keywords: Acinetobacter baumannii; OmpR; Polymorphism; MDR
Introduction![]()
The Gram-negative bacteria Acinetobacter baumannii is known as a Multi-Drug Resistant pathogen because of its extraordinary capacity to develop resistance to several antibiotics [1]. Since MDR A. baumannii infections are challenging to treat and frequently result in higher rates of morbidity and death, this resilience poses a serious threat to global public health [2,3]. It’s essential to comprehend the molecular processes behind this resistance in order to create efficient treatment approaches [2,4]. The Two-Component System (TCS) response regulator OmpR function in the MDR phenotype of A. baumannii is discussed in this article through a thorough examination of its sequence. In order for bacteria to detect and react to changes in their environment, they need a basic signaling system called the Two-Component System (TCS) [5]. A sensor kinase and a response regulator are the two main proteins found in it. Many Gram-negative bacteria, including A. baumannii, include the response regulator protein OmpR [6]. It is essential for controlling how genes are expressed in response to different environmental signals [7]. It is well known that OmpR controls several virulence factors and outer membrane proteins in A. baumannii. By attaching to certain DNA sequences and modifying the expression of target genes, it functions as a transcription factor [8]. Even though OmpR function in regulating membrane permeability and virulence is well known, research on the protein's connection to MDR is still ongoing. Researchers have thoroughly sequence-analyzed the OmpR protein in order to learn more about its function in MDR A. baumannii. This approach entails looking at the OmpR amino acid sequence, locating conserved domains, and contrasting it to OmpR sequences in non-MDR strains.
Methods![]()
Bacterial isolation and identification
A total of 25 isolates were collected for three months, from April 2023 to June 2023, at the Baghdad Teaching Hospital's Central Children's Hospital. Urinary tract infection patients provided the isolates. The isolates were characterized using the VITEK 2 System. This involved the use of VITEK2 Identification Cards and medium to carry out biochemical reaction with the bacterial isolates suspended in their solution. The samples were transported carefully to the laboratory using transport media, where they were cultured using A. baumannii-selective medium (Chrom agar) and MacConkey agar. The colony properties, including the color, shape, edges, and texture of the emerging colony, were observed during the course of the incubation, which was conducted at 37°C for 24 hours under aerobic conditions [9]. The isolates were subjected to antibiotic sensitivity testing through the use of the disk diffusion method with sixteen different antibiotics. Using the criteria offered by the Clinical and Laboratory Standards Institute (CLSI, 2020), the outcomes were interpreted. After 24 hours of incubation at 37°C, bacterial DNA was extracted from Nutrient agar plates using the boiling procedure, as explained in [10]. Using PCR methods and comparisons to positive reference strains, the genotyping detection procedure required establishing the presence of the blaOXA-51 gene unique to A. baumannii [10].
Preliminary test of PCR and amplification
The PCR technique used the Applied Biosystem PCR System 9700 and Promega's 2x PCR Master Mix Solution kit to amplify the OmpR gene with primers produced by Primer3. The primers were: Forward 5′-TGAGTTTAGTTGTACCTGCTGA-3′ and Reverse 5′-TATTCAGCACCATCCGGAAC-3’. Gel electrophoresis identified a ~763 bp amplicon. The procedure included 30 cycles of 4 minutes at 94°C, 30 seconds at 94°C, 45 seconds at 54-61°C, 90 seconds at 72°C, and a final 4 minutes at 72°C.
Electrophoresis
During the electrophoresis technique, TBE 1X buffer was added to the chamber and the agarose gel immersed. A 100bp DNA ladder and 5µL of PCR results were added to the wells. The chamber was operated at 100V for 30 minutes. The results were seen and recorded as DNA bands using UV light [10].
DNA sequencing method
The OmpR gene of pathogenic A. baumannii isolates was analyzed phylogenetically using DNA sequencing. The gene was extracted from an agarose gel using Biobasic's EZ-10 Spin column DNA gel extraction kit, purified, and delivered to Macrogen Company (Korea) for sequencing. Mega version 11 was used for phylogenetic analysis, which used NCBI-Blast alignment and the neighbor-joining method.
Antibiotic Susceptibility in A. baumannii Isolates
A. baumannii was isolated from individuals with urinary tract infections, and a number of medications were chosen for testing against the isolates. The disc diffusion method (Kirby Power) involves inoculating the plates with bacterial isolates, then placing antibiotic-impregnated discs on the plates, incubating them, and measuring the zones of inhibition.
Broth dilution method: Dilute antibiotics repeatedly, inoculate with bacterial cultures, and determine the minimal inhibitory concentration [10]. Antibiotic effectiveness was evaluated by comparing zones of inhibition or MIC values between Bins 1 and 2. A correlation matrix was created to investigate antibiotic interactions and possible cross-resistance. The isolates' OmpR genes were sequenced to find point mutations and determine their influence on resistance.
Polymorphism detection
Use the following equation for each site to determine the polymorphism for that particular site:
(Number of Different Nucleotides at the Site / Total Number of Isolates) x 100 = Polymorphism (%).
Statistical analysis
All statistical analyses were performed utilizing the R programming language.
Results![]()
Patients who had severe UTI infections allowed for the collection of a total of 25 A. baumannii isolates. Patients varied in age from 18 to 70, with a female to male ratio of 1.5.
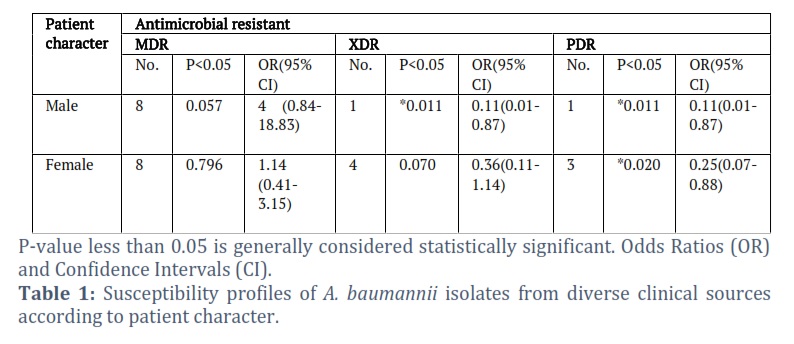
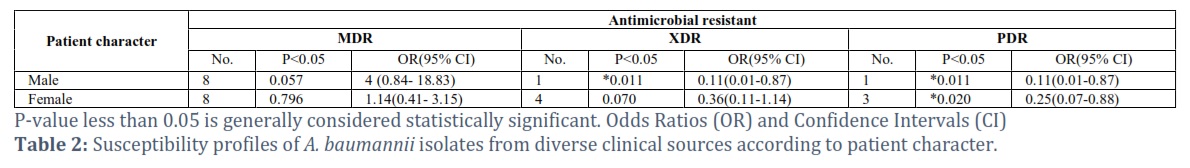
Table 1 shows the general susceptibility profiles of A. baumannii isolates from diverse clinical sources according to patient character. There were three types of A. baumannii that were all studied: MDR, XDR, and PDR. The table shows a statistically significant association (p-value < 0.05) between being male and having any antimicrobial resistance, MDR, and XDR. Males have a statistically significant association with MDR (p-value = 0.057). The OR of 4 (CI: 0.84-18.83) suggests that males are 4 times more likely to have MDR bacteria compared to females. Both XDR and PDR have statistically significant p-values for males, suggesting an association with being male.
Data points are categorized in the Histogram figure 1 by "Bin 1" and "Bin 2" according to the value of a certain variable. Data points with values between 0 and 0.5 are included in Bin 1, whereas those with values between 0.5 and 1 are included in Bin 2. When comparing Bin 1 (0-0.5) to Bin 2 (0.5-1), all antibiotics shown a statistically significant increase in efficacy, demonstrating that they become more effective at the upper range (Bin 2) of the variable under study. As a result, the antibiotics in this bin are more likely to be effective in treating bacterial infections.
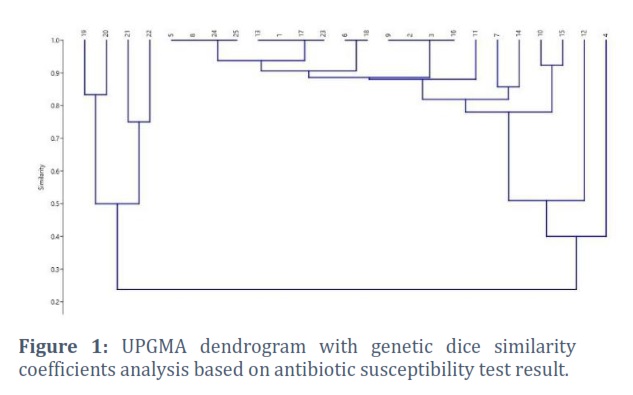
It is feasible to divide these isolates into two major clusters based on the similarity values, figure 2, in the given data. Isolates 19, 20, 21, and 22 belong to Cluster 1. Higher similarity ratings between these isolates show more interdependence. 21 isolators make up Cluster 2. Compared to isolates in Cluster 1, these isolates are more related to one another while having lower intra-isolate similarity scores. The resistance to the carbapenem group makes isolate 4 a distinct clone even today.
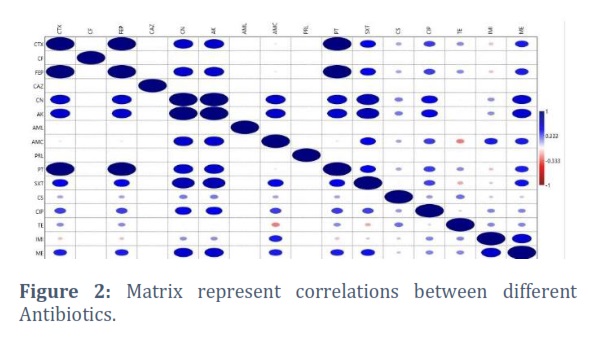
Figure 2 of the given matrix purports to show correlations or similarities between several antibiotics. Between 0 and 1, the correlation value ranges from no correlation (or dissimilarity) to a perfect positive correlation (or likeness). Based on the presented matrix, the following observations are made about how the elements are correlated: both CTX and CTX have a perfect correlation of 1, as one might anticipate. The perfect correlation between CF and every other item is 1, suggesting that CF and every other item have a strong association.
While Moderate to Strong Correlation appear between FEP and a number of categories, such as CTX, CF, CAZ, AK, AMC, and PT, ranges from modest to high. There is a moderate to significant correlation between CN and AK as well as with a number of other factors.
As well as, weak Correlation detected between AML, PRL, and TE, for instance, exhibit sporadic weak associations with numerous other items. Negative Correlation indicted between IMI and ME, exhibit inverse correlations with a few other items, indicating a reversible association.
Overall, the matrix gives an indication of how closely items are related to one another, with values ranging from high positive correlations (near to 1) to weak or no correlations (close to 0). Depending on the exact context and the characteristics of the variables being examined, these correlations will need to be interpreted.
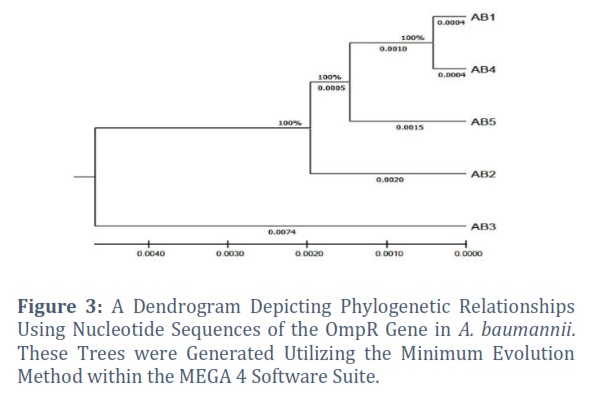
According to the presented similarity or distance matrix, the AB3 isolate has a lesser resemblance to the other isolates (AB1, AB2, AB4, and AB5) than those shown in table 2. A lower value suggests a lower pairwise similarity or a higher distance between isolates. The values in the matrix represent these pairwise similarities or distances.
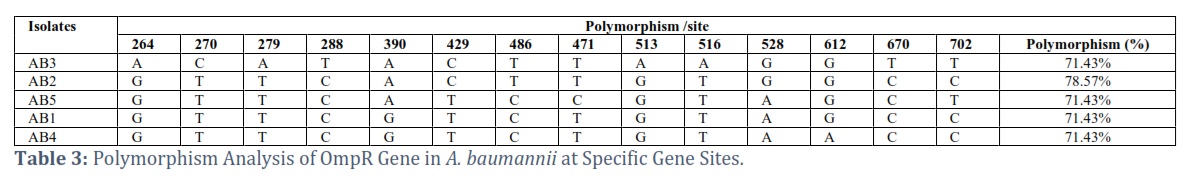
Each row in this table 2 represents an isolate, and each column each site. The proportion of polymorphism for each site, as determined by the nucleotide differences seen across the isolates, is shown in the "Polymorphism (%)" column.
The OmpR gene appears to have the greatest degree of diversity among isolates at position 288 based on the data. At this location, a "T" nucleotide is present in one sample (AB3) and a "C" nucleotide is present in the remaining isolates (AB2, AB5, AB1, and AB4). The "OmpR" gene has a polymorphism percentage of 71.43% at site 288 as a result, showing that there is a considerable amount of diversity among the isolates at this particular site.
According to the calculations, the average polymorphism for all isolates (AB2, AB5, AB1, AB4) is the same, ranging from 1-3 polymorphic sites, showing that there is little general diversity in the OmpR gene across these isolates. With 11 polymorphic sites out of a total of 14 mutation sites, isolate AB3 has the greatest average polymorphism, showing a little bit more variety overall than the other isolates.
With a homozygous proportion of 7.14% and a percentage of heterozygosity of 92.86%, only OmpR in isolate AB3 exhibits heterozygosity. At the 270, 279, 288, 390, 429, 486, 471, and 513 locations, all isolates are homozygous 100%. On the other hand, at positions 528,612,670 and 702, all isolates had a heterozygous rate of 100%. The The OmpR gene displays various types of mutations at certain loci, and some isolates are distinguished by the presence of mutations in specific places while others do not. This provides a clearer understanding of how genes change and are passed down through generations. Isolate AB3 from table 3 has a combination of Transition (Ti) and Transversion (Tv) polymorphisms at different OmpR sites. At a few locations, Isolate AB2 predominantly displays Transition (Ti) polymorphisms. Isolate AB5 possesses distinct Transition (Ti) and Transversion (Tv) polymorphisms. At one location, Isolate AB1 has a Transition (Ti) polymorphism. Transversion (Tv) and Transition (Ti) polymorphisms may be seen in Isolate AB4 at different sites.
In order to choose the nucleotide substitution model that best fits the data, we often seek for the model with the lowest BIC (Bayesian Information Criterion) or AICc (Akaike Information Criterion, corrected) value. The models are ranked by rising BIC values (data not shown), thus the model with the lowest BIC would have the best fit. The "T92" model, with a BIC value of 2386.132, has the lowest BIC value according to the table you've given. This shows that, of the models you've tried, the T92 model is the best suitable for capturing the nucleotide substitution pattern in your data. Lower substitution rates are usually between similar types of bases (purines with purines or pyrimidines with pyrimidines). For example, A to C = 0.0146. Higher substitution rates occur between different types of bases. For example, G to T = 0.2409.
The pairwise nucleotide substitution rates between the bases A, T, C, and G appear in table 3. The rates at which one base is switched out for another are shown by these values. The values in these tables often correspond to probabilities or substitution rates. The numbers off the diagonal correspond to the rates of base substitution. The number at row A and column T (A to T), for instance, is 0.018172908, which represents the rate at which adenine (A) is swapped out for thymine (T). A to T substitution rate: 0.018172908,A to C substitution rate: 0.014600017,A to G substitution rate: 0.193545065,T to C substitution rate: 0.240909086,T to G substitution rate: 0.018172908 and C to G substitution rate: 0.014600017.
The relative rates of nucleotide substitution are shown by these numbers. Adenine (A) is more likely to transform to guanine (G) in our dataset, according to the high rate of substitution from A to G (0.193545065).
Figures & Tables
The fact that these isolates came from patients ranging in age from 18 to 70 years old implies that A. baumannii UTIs can afflict people of all ages. This discovery emphasizes the importance of being cautious while identifying and treating UTIs in people of all ages. The 1.375 male to female ratio among patients with A. baumannii UTIs may suggest a little male preponderance. In a similar way, a total of 26 A. baumannii isolates were discovered and connected to a variety of serious hospital acquired illnesses [11]. offered a description of the development of A. baumannii inside urinary tract infections (UTIs) in the similar situation [12]
All antibiotics demonstrated a significant increase in efficacy when moving from Bin 1 (0-0.5) to Bin 2 (0.5-1), indicating that their efficacy significantly increases within the upper range (Bin 2) of the investigated variable. As a result, medicines in this bin have a higher rate of success and are more effective at battling bacterial illnesses. The potential for improving treatment outcomes for bacterial infections is highlighted by the notable rise in antibiotic efficacy seen when the variable moves from Bin 1 to Bin 2. These findings support a personalized approach to antibiotic therapy that takes into consideration the distinct variables that affect their efficacy, eventually resulting in more effective therapies and superior patient care. The variety of infections and resistance patterns support the commonly held belief that antibiotic prescriptions should be customized depending on the resistance profile of the illness, which has prompted the development of techniques to more accurately predict resistance [13].
Although not always based on genomic markers, antibiogram typing is a straightforward, time-consuming, and inexpensive technique that allowed researchers to look into a bacterial outbreak in the absence of modern molecular typing methods [14]. The correlation matrix is a useful tool for comprehending how the many antibiotics under investigation interact with one another. The unique environment and the characteristics of the studied drugs should be taken into account when interpreting these associations. This data may be used by researchers and analysts to spot trends, dependencies, or resemblances that may have an impact on future research or decision-making in their respective domains.
There is a significant correlation between CF and all other antibiotics. This suggests that CF is very comparable to or closely related to all the factors that were assessed. Further research is needed to determine the causes of this high association. FEP and various antibiotics, including CTX, CF, CAZ, AK, AMC, and PT, have a weak to strong correlation. This shows that FEP and these antibiotics have a lot in common, possibly in terms of their targets, modes of action, or therapeutic uses. Similarly, there are moderate to high relationships between AK and CN as well as with a number of other antibiotics. This suggests that these antibiotics and the others in the matrix may share or exhibit cross-resistance. These associations can be significant when choosing an antibiotic for a therapeutic setting.
Additionally, Weak Some antibiotics, including AML, PRL, and TE, show modest correlations with many other antibiotics in the matrix when the correlation between isolates is displayed. This implies that there is just a slight degree of resemblance or common traits between these things and the others. Finally, there are a few additional drugs with which IMI and ME have unfavorable relationships. This suggests that if the amount of one of these medicines increases, the corresponding items should also decrease. clinical implications may arise from the nature of this inverse connection, which may point to potential antagonistic effects or alternative mechanisms of action.
According to the supplied similarity or distance matrix, AB3 among the isolates has a noticeably lower level of similarity when compared to the other isolates (AB1, AB2, AB4, and AB5). Lower values indicate a reduced similarity or an increased distance between isolates. The values in this matrix represent the pairwise similarities or distances between isolates.
Our research has shown that an alteration in the OmpR gene may cause the OmpC and OmpF genes to become inactive. This result is consistent with earlier in vitro research [15,16]. These investigations showed that a single mutation in OmpR led to a subsequent decrease in OmpC and/or OmpF levels, which in turn greatly increased the minimum inhibitory concentration (MIC) for ertapenem, with decreases of up to 90% recorded [15,16].
Our study contributes to the expanding body of research on the clinical significance of OmpR mutations in the emergence of antibiotic resistance in A. baumannii clinical isolates. These findings emphasize the importance of monitoring and analyzing such alterations in the setting of antibiotic resistance and highlight the significant influence that OmpR mutations can have on the antibiotic sensitivity of A. baumannii isolates.
The sequence analysis revealed that the majority of point mutations were transitional and accumulated in AB3 isolates. This may have been because to the isolates being exposed to more stressful circumstances than other isolates, especially since they were PDR.
These numbers show the relative nucleotide substitution rates. According to our dataset, adenine (A) is more likely to change to guanine (G) than guanine (G) because of the high substitution rate from A to G (0.193545065).
The data demonstrated that there is a dearth of genetic diversity at the majority of the locations (264, 270, 279, 288, 390, 429, 486, 471, 513). All isolates at these locations are 100% homozygous, indicating that they all possess the same allele. On the other hand, because heterozygous alleles are present at sites 516, 528, 612, 670, and 702, there is genetic diversity at those locations.
Composition at Particular Locations: Site 264: Genetic diversity at this location is high, with 92.86% of isolates being heterozygous (A/C), indicating possible heterogeneity in the area.
Sites 516, 528, 612, 670, and 702 all carry 100% Heterozygous alleles (A/T), which is an indication of a high degree of genetic variation at these locations. This shows that the bacterial pathogenicity at these locations may be more varied.
In conclusion, our research highlights the vast age range of those affected by A. baumannii urinary tract infections, underscoring the importance of thorough diagnosis and treatment across age groups. The observed shift in antibiotic efficacy from Bin 1 to Bin 2 suggests that customized treatment strategies may be able to combat bacterial infections with greater success. The correlation matrix also reveals intriguing relationships between antibiotics, illuminating shared characteristics and functions. Our research suggests that structural changes in OmpR may lead to the development of resistance in A. baumannii for the first time in Iraq. The genetic diversity study raises concerns regarding virulence and adaptation while highlighting the range of A. baumannii isolates found in different locations. We need more study to better understand how antibiotic effectiveness and resistance mechanisms work in A. baumannii infections.
Author Contributions
Israa Radwan Ali : Conceptualization, Writing – original draft.
Israa Radwan Ali, Duaa Mohammed Abdulsatar : Methodology, Data curation
Israa Radwan Ali, Ruqaia Sabbar Salman: Formal analysis, Data curation
Israa Radwan Ali, Anfal Mohammed Khudhair: Validation , Data curation, Writing – review & editing
The author declare that there is no conflict of interest regarding the publication of this paper.
![]() References
References
- Kadhom HA, Ali MR. Epidemiological Molecular Analysis of Acinetobacter baumannii isolates using a multilocus sequencing typing and Global lineage. Ibero-American Journal of Biotechnology and Life Sciences, (2012); 7(1): 29.
- Ali IR, Majeed SH. Distribution of Two-component QS gene in Acinetobacter baumannii. Biochemical & Cellular Archives, (2021); 21(2): 4829
- Ridha DJ, Ali MR, Jassim KA. Molecular analysis of multi–drug resistant Acinetobacter baumannii isolated in Baghdad hospital. International Journal of Research in Pharmaceutical Sciences, (2019); 10(3): 1970-1987.
- Ridha DJ, Ali MR, Jassim KA.Occurrence of Metallo-β-lactamase Genes among Acinetobacter baumannii Isolated from Different Clinical Samples. Journal of Pure & Applied Microbiology, (2019);13(2):1111-1119.
- Tierney AR, Rather PN. Roles of two-component regulatory systems in antibiotic resistance. Future microbiology, (2019); 14(6): 533-552.
- Palethorpe S, Farrow JM, Wells G, Milton ME, Actis LA, Cavanagh J, Pesci EC. Acinetobacter baumannii regulates its stress responses via the BfmRS two-component regulatory system. Journal of bacteriology, (2022); 204.2: e00494-21.
- Huo, Xiaoping, Chunmei D, Huiqin Huang, Hanjie G, Xiwen D, Yonghua H. "TCS response regulator OmpR plays a major role in stress resistance, antibiotic resistance, motility, and virulence in Edwardsiella piscicida." Aquaculture 559, (2022): 738441.
- Tipton KA, Rather PN. An ompR-envZ two-component system ortholog regulates phase variation, osmotic tolerance, motility, and virulence in Acinetobacter baumannii strain AB5075. Journal of bacteriology, (2017); 199(3): 1110-1128.
- Atlas RM, Brown AE , Parks LC . Laboratory Manual of Experimental Microbiology. 1997. 1sted. Mosby, st. Louis U.S.A.
- Shayea RH, Ali MR. Whole-genome Study of Carbapenem-resistant Acinetobacter baumannii Virulence and Resistance. Iranian Journal of Medical Microbiology. (2023); 17(1): 90-102.
- Antunes LC, Visca P, Towner KJ. Acinetobacter baumannii: evolution of a global pathogen. Pathogens and disease, (2014); 71(3): 292-301.
- Jiménez-Guerra G, Heras-Cañas V, Gutiérrez-Soto M, del Pilar Aznarte-Padial M, Expósito-Ruiz M, Navarro-Marí JM, Gutiérrez-Fernández, J. Urinary tract infection by Acinetobacter baumannii and Pseudomonas aeruginosa: evolution of antimicrobial resistance and therapeutic alternatives. Journal of medical microbiology. (2018); 67(6): 790-797.
- Yelin I, Snitser O, Novich G, Katz R, Tal O, Parizade M, Kishony R. Personal clinical history predicts antibiotic resistance of urinary tract infections. Nature medicine, (2019); 25(7): 1143-1152.
- Abed E, Ali M. Molecular analysis of efflux pumps and quorum sensing genes in Mdr Acinetobacter baumannii. Biochemical & Cellular Archives, (2020);20(1): 2259-2266 .
- Tängdén, T, Adler M, Cars O, Sandegren L, Löwdin E. Frequent emergence of porin-deficient subpopulations with reduced carbapenem susceptibility in ESBL-producing Escherichia coli during exposure to ertapenem in an in vitro pharmacokinetic model. Journal of Antimicrobial Chemotherapy, (2013); 68(6): 1319-1326.
- Adler M, Anjum M, Andersson D I, Sandegren L. Influence of acquired β-lactamases on the evolution of spontaneous carbapenem resistance in Escherichia coli. Journal of Antimicrobial Chemotherapy, (2013); 68(1): 51-59.
This work is licensed under a Creative Commons Attribution-Non Commercial 4.0 International License. To read the copy of this license please visit: https://creativecommons.org/licenses/by-nc/4.0![]()