

Full Length Research Article
First Report on Clinical Feasibility of Dried Blood Spot Technique for Hemoglobin Estimation in Cholistani Cattle
Maryam Chaudhary1, Umer Farooq2*, Musadiq Idris2, Mushtaq Hussain Lashari1, Saira Qasim1, Muhammad Abrar Afzal2, Musarrat Abbas Khan3, Asad Ali2
Adv. life sci., vol. 11, no. 3, pp. 663-668, August 2024
*– Corresponding Author: Amal F. Gharib (r.amal.f.gharib@gmail.com)
Authors' Affiliations
2. Department of Physiology, The Islamia University of Bahawalpur – Pakistan
3. Department of Animal Breeding and Genetics, The Islamia University of Bahawalpur – Pakistan
[Date Received: 17/12/2023; Date Revised: 07/04/2024; Date Published: 10/07/2024]
Abstract![]()
Introduction
Methods
Results
Discussion
References
Abstract
Background: The dried blood spot (DBS) technique using filter papers has revolutionized the conventional blood sampling techniques through ease of blood collection, storage and transport. Various analytes (such as hormones, antigens, antibodies and hematochemical attributes) are being estimated through DBS globally. However, this technique has not yet been implied in Pakistan. This research work is the first of its kind regarding hemoglobin (Hb) estimation in Cholistani cattle (n=63) blood through DBS technique using filter paper.
Methods: Three methods of Hb estimation were implied in the present study viz. through veterinary hematology analyzer (HbA), and two indirect cyanmethemoglobin methods (HbIC and HbICX) using measured (20µL) and unmeasured blood drops on the filter paper, respectively.
Results: Results revealed that HbA and HbIC were non-significantly (P≥0.05) different from each other, being different from HbICX (P≤0.05). The HbICX gave overestimated values of Hb as compared to HbA and HbIC. The sensitivity, specificity, positive predictive value, and negative predictive value for HbIC were higher being 86.1%, 88.3%, 88.0%, and 86.0%, respectively as compared to the lower values of 45.0%, 12.0%, 12.0% and 45.0%, for HbICX. Bland and Altman test revealed a better level of agreement between HbA and HbIC. Around the mean difference line, there was no proportional bias in data distribution (Mean= -0.16, 95% CI= 0.34 to -0.67). Similarly, measures attained through Cronbach alpha and intraclass correlation coefficient between HbA and HbIC were higher being 0.703 and 0.825 values for single and average, respectively, as compared to the values of 0.200 and 0.333 between HbA and HbICX.
Conclusion: It is concluded that the indirect cyanmethemoglobin method for Hb estimation is reliable and accurate for cattle blood, if a measured quantity of blood drop is taken on a filter paper. We recommend this DBS technique for Hb estimation in cattle blood for resource-poor settings and for livestock herds being reared distantly from the laboratories. For future, it is recommended that DBS technique with various other modifications and for other hematochemical biomarkers may be validated for livestock blood.
Keywords: Dried blood spot; Hemoglobin; Cholistani cattle
Introduction![]()
Owing to their conducive environment (high temperature and humidity), the livestock of Warm-Climate-Zones of the world, including Pakistan, have always been vulnerable to ticks and tick-borne diseases e.g., theileriosis, babesiosis, and anaplasmosis [1]. Resultantly, the direct effects of ticks (anemia, weight loss and damage to skin and hides), and indirect effects (financial losses and transmission of pathogenic viruses/protozoa) become evident in the animals. Compromised livestock productivity and elevated mortality, hence, affects the socio-economic profile of the livestock herders [2].
It has been well elaborated that the most evident and patent sign of a tick-borne-disease in livestock is anemia. The hemoglobin (Hb) level, RBC count and packed cell volume (PCV) provide a mainstay for laboratory diagnosis of anemia in the livestock [3,4]. Various methods of Hb estimation such as Tallquist method, copper sulphate method, Sahli’s method, Lovibond comparator, cyanmethemoglobin method, Hb color scale, and HemoCue have been reviewed extensively regarding their advantages and disadvantages [5]. These methods have mostly been tested for their precision, accuracy, sensitivity, specificity and repeatability for human blood [6-8]. The cyanmethemoglobin method, amongst these, has been ascertained as gold standard technique for Hb estimation. As compared to these methods, the 3-part and 5-part automated hematology analyzers are being used frequently to monitor Hb levels. This is an accurate and reliable approach, but it is costly, and the transfer of blood samples to distantly located laboratories may hinder quick treatment. Ultimately this leads to disease aggravation [9]. A few vital factors such as expensiveness, need of high and periodic maintenance, skillful personnel and expensive reagents result in a limited use of automated analyzers in resource-poor countries such as Pakistan.
All the Hb estimation methods normally require a minimum of 2mL blood sample which is quite a lot when considered for veterinary medical practice. This is further complicated by the on-field whole blood sampling in which after sampling, the samples are to be transported to distant laboratories under appropriate packaging. Keeping this in perspective, it is inevitable to devise and validate alternate sampling protocols for livestock being less stressful, needing least restraint of animals, are feasible to be transported can bear temperature variations. [10-12].
In dried blood spot (DBS) technique, a drop of blood is placed on a porous membrane/paper, dried and analyzed in the laboratories for various hematochemical biomarkers, hormones and drugs. Its use was initiated back in 1963 by Dr. R. Guthrie who used it for detection of phenylketonuria in newborn babies [13,14]). Gradually, in human medical diagnostics, this novel sampling technique became in vogue, especially for screening of various neonatal diseases [14], hormones [15,16], drugs [17], virus load [18,19] and hematochemical biomarkers [20,21]. For veterinary diagnostics, however, the research regarding the use and diagnostic efficacy of DBS is still scanty. The work previously reported has mostly been on pregnancy-associated-glycoproteins in cattle [12], bovine trypanosomiasis [22], and a few bovine viruses [23,24]. There is utter scarcity of research work related to the estimation of Hb through DBS in cattle. The present study, therefore, is the first report from Pakistan on assessment of clinical feasibility of DBS for Hb estimation in Cholistani cattle blood.
Methods![]()
Study site: The study was conducted at the post-graduate laboratory of the Department of Physiology, The Islamia University of Bahawalpur (IUB), Pakistan from May to July 2023 located at the outskirts of the Cholistan desert. The Cholistan desert is about 112m above sea level. It is sprawling in 26,000 km2 area is located in latitudes 27°42′ and 29°45′ North, longitudes 69°52′ and 75°24′ East [25]. Its arid and semi-arid tropical climate has an average temperature of 28.33°C. Month of June is considered as being the warmest month showing a temperature of up-to 45°C. The recorded annual rainfall of this desert is up to 180mm. From November till January, the weather is at its coldest when the temperature is about 13°C.
Study animals: Cholistani cattle (n=63) being harbored under intensive farming system at the University Livestock Farm were incorporated in the study. Similar management and feeding patterns are being maintained for them at the farm. In order to ascertain the general health status of the animals, focal group discussions (FDGs) were carried out with the personnel of the farm. In addition, clinical examinations including temperature, pulse, respiratory rate, and behavioral patterns were also carried out. Resultantly, only apparently healthy animals were incorporated in the study. Animals showing signs of lethargy, anorexia, off-feed and segregation from their herds were excluded from the present study. Under the nomadic pastoralism livestock system of the desert, all the young animals are kept in their pens near the water sources (Tobas) whereas the adult animals are sent for grazing, and this is termed as split-herding [25].
Ethics statement: Apropos to PHYSIO-77/2023 (10-03-2023), this MPhil research work was approved by the Departmental Research Ethics Committee, Department of Physiology, IUB, Pakistan.
Blood collection: Blood samples were drawn from the jugular vein of the cattle using a disposable syringe as per prescribed protocol, in EDTA-containing purple-topped vacutainers (Becton Dickinson, USA). They were gently inverted, and transferred in an icebox to the laboratory where they were tested for hemoglobin estimation within 2 hrs.
Hemoglobin estimation: In this study, three methods for the estimation of Hb concentration in Cholistani cattle blood were implied viz. one through hematology analyzer and two through indirect cyanmethemoglobin method using DBS, as given below:
- Automated veterinary hematology analyzer: Before analysis by an automated hematology analyzer, each blood sample was gently mixed by keeping it on a Roller Mixer (MixR-40, Daihan Scientific, Korea). Analysis for Hb concentration (HbA) was conducted using a multi-species, off-hand validated veterinary hematology analyzer (Rayto RT-7600, China). This HbA was considered as the gold standard technique for Hb determination for the present study.
- Indirect cyanmethemoglobin methods using dried blood spot: For this method, priorly prescribed protocol was implied [20,27], with minor modifications, and two methods were implied for measuring Hb in two different ways using DBS on the filter paper (Whatman Grade 42, Sigma Aldrich, Germany). This filter paper has a maximum ash of 0.007%, pore size of 2.5µm, and Herzberg filtration speed of 1870S. In first method, 20µL of measured blood was placed on the filter paper, and the paper was allowed to dry on a non-absorbent surface. This paper was then placed in a test tube containing 5mL of Drabkin’s solution (Drabkin’s Reagent, CAT D5941, Sigma Aldrich, Germany). After the incubation period of 1hr, the solution containing the eluted blood spot was vortexed for 2mins, reincubated for another half hr, and finally analyzed for O.D through spectrophotometer (Irmeco GmbH & Co, Germany, Model U2020 UV-VIS) at 540nm and Hb was estimated through standard curves (HbIC) using Hb standard solution. In second method, using the similar filter paper, an unmeasured drop of blood was placed on it, allowed to dry and a 5mm hole (~5µL of blood) was punched with an office hole-puncher. It was transferred to 1.25mL of Drabkin’s solution, and after the incubation of 1hr, O.D was taken spectrophotometrically, and Hb was ascertained as given for first method (HbICX) [28].
Statistical analysis: Statistical Package for Social Science (SPSS for Windows version 12, SPSS Inc., Chicago, IL, USA) was used for data analyses. Data was analyzed for normality visually, as well as through Shapiro-wilk test. Means (±SE) and 95% CI for the three Hb values (HbA, HbIC and HbICX) attained in this study were computed using prescribed formulae. To attain difference between the three Hb values for overall data as well as for various study groups viz. age-wise (G1 up till 1 year, n=20; G2 from 1 to 2 years, n=20; G3 above 3 years, n=23) and sex-wise (males, n=26 and females, n=37), ANOVA with Duncan’s as post-hoc test was implied. Pearson’s correlation coefficient and linear regression were implied to deduce the level of correlation between the three Hb values. Accordingly, regression prediction equations were computed. Keeping a cut-off value of 9.6g/dL, sensitivity, specificity, positive predictive value (PPV) and negative predictive value (NPV) were calculated for HbIC and HbICX [29]. Level of agreement between the three methods assessed through Bland Altman Agreement Analysis [30]. Similarly, Cronbach alpha and intraclass correlation coefficient were also implied on overall data as tests of agreement between HbA and HbIC, and between HbA and HbICX [31,32].
Results![]()
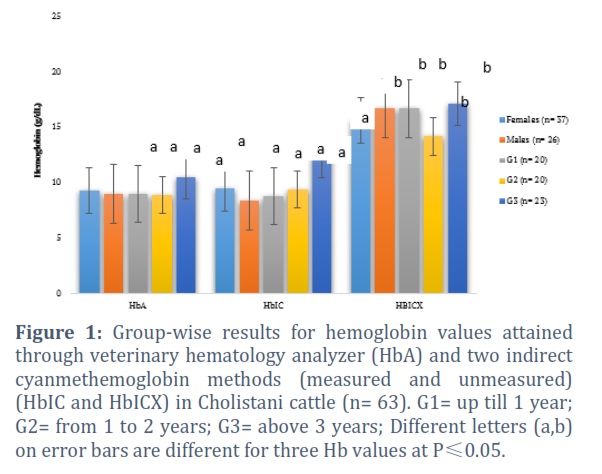
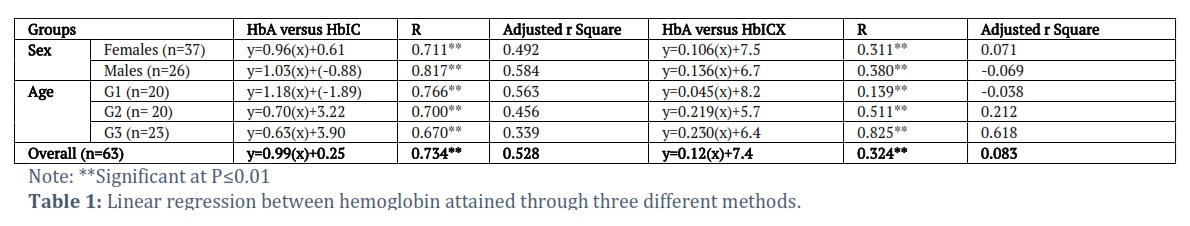
The overall mean (±SE) values for HbA, HbIC and HbICX obtained through hematology analyzer and through two indirect cyanmethemoglobin methods using DBS in the present study were 9.2±0.2, 9.3±0.3 and 15.8±0.8g/dL, being significantly (P≤0.05) higher for HbICX. The group-wise and overall results revealed that HbA and HbIC were statistically (P≥0.05) non-significant whereas, they both were statistically (P≤0.05) different from HbICX (Fig 1). The HbICX gave overestimated Hb values as compared to those attained by other two methods. The results of regression analyses and the regression prediction equations for overall as well as for all the study groups (age- and sex-wise) have been given in Table 1. The HbA and HbIC had a positive correlation (P≤0.01) (r= 0.734; adjusted r-square= 0.528). Similarly, the correlation coefficient between HbA and HbICX was r= 0.324 with an adjusted r-square= 0.083) being higher between HbA and HbIC.
The sensitivity, specificity, PPV, and NPV for HbIC were higher being 86.1%, 88.3%, 88.0%, and 86.0%, respectively as compared to the lower values of 45.0%, 12.0%, 12.0% and 45.0%, for HbICX.
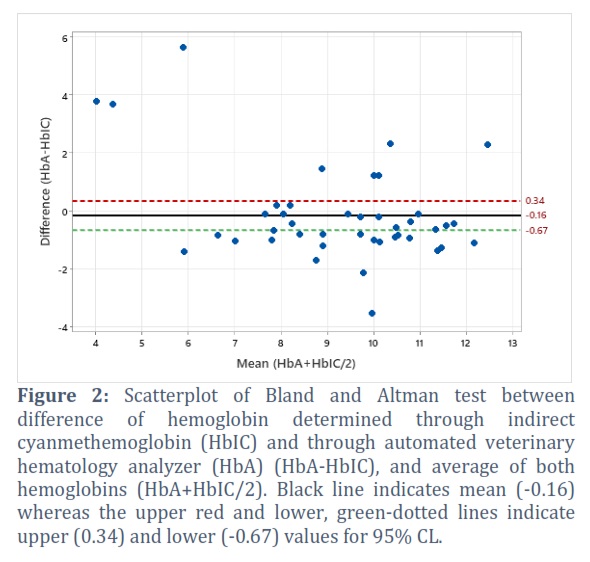
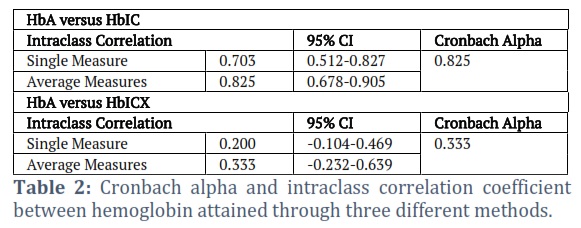
Regarding the level of agreement, Bland and Altman chart between HbA and HbIC (Fig 2) showed a better level of agreement between HbA and HbIC having a relational bias of data distribution around the mean difference line (Mean = -0.16, 95% CI = 0.34 to -0.67). Regarding the other tests of level of agreement viz. Cronbach alpha and intraclass correlation coefficient, both the values for single measure and average values were higher between HbA and HbIC being 0.703 and 0.825 as compared to the values of 0.200 and 0.333 between HbA and HbICX (Table 2).
Figures & Tables
Blood profiling and analyses is one of the vital diagnostics/prognostic tools both in human and veterinary medical practice. Clinical hematology has resultantly attained substantial advancement globally especially for the diagnosis/prognosis of blood-borne disorders and novel sampling methods are being tested for their diagnostic efficacy. For veterinary medical practice, blood sampling is a major issue of concern due to restraint of animals, and appropriate transport of the sample to distantly-located laboratories. Cholistani breed of cattle are reared in the desert under pastoralism and split-herding is implied. According to this livestock pastoral system, the natural or man-made water reservoirs (‘Tobas’ in local dialect) are selected. Young animals are confined in their pens near these ‘Tobas’. However, the adult animals are led to grazing along with Cholistani herders. Remotely located laboratories for these livestock make it difficult for the desert livestock herders to get their animals timely screened or tested for diseases. It, hence, seems inevitable to devise and validate alternate sampling protocols for livestock being least stressful, needing least animal, are feasible to be transported, and can bear temperature fluctuations within a certain limit. The present work is a novel one being reported for diagnostic efficacy of DBS using filter paper for Hb estimation in Cholistani cattle blood. And it reveals that a quantified drop of blood (20µL) on filter paper provides reliable results of Hb as compared to the Hb attained through gold standard method. There is scarcity of research work on the diagnostic accuracy and efficacy of DBS using filter paper for Hb estimation for livestock blood, hence the comparisons for the sake of discussion have been made with the studies conducted on human blood, wherever needed.
In the present study, results revealed that HbA and HbIC were non-significantly different whereas, they both were statistically different and higher from HbICX. These results were the same group-wise and overall data of the present study. This indicates that the measured drop of blood (20µL) taken on a filter paper in present study gives reliable results for Hb, comparable to those by the gold standard method (hematology analyzer for the present study). However, in our results Hb estimated through DBS using 5mm punch of the filter paper gave higher results. Results similar to ours have been reported in various previous studies using human blood. From India, while assessing anemia in pregnant women, 20µL of blood on Whatman filter paper was used. And this BDS technique was endorsed to be a reliable technique for Hb estimation [33]. Similar to the results of our study attained for Hb using 5mm filter paper punch, yet two other studies from India which were aimed to assess the diagnostic efficacy of indirect cyanmethemoglobin method in adolescent girls have also reported that the punch method gives overestimated values for Hb [20,27]. They endorsed that the values of Hb, being overestimated, needed a correction factor for their appropriateness. On the contrary, certain other studies have successfully detected Trypanosoma congolense and T. brucei in cattle blood using both the Whatman Grade 41 and 42 filter papers [10, 34].
The sensitivity, specificity, PPV, and NPV for HbIC were higher being 86.1%, 88.3%, 88.0%, and 86.0%, respectively as compared to the lower values of 45.0%, 12.0%, 12.0% and 45.0%, for HbICX. While using human blood in research work, an even higher sensitivity of 99.2% has been reported through indirect cyanmethemoglobin method [20]. The overall sensitivity (86.1%) and specificity (88.3%) of HbIC in the present study seems quite satisfactory for Hb estimation in cattle. Though future further validations of this technique may render these values even higher.
In the present study, three tests to assess the level of agreement viz. Bland Altman, Cronbach alpha and intraclass coefficient were implied between HbA and HbIC, and between HbA and HbICX. A better level of agreement was noticed between HbA and HbIC. The relational bias was not noticed regarding the data distribution around the mean difference line (Mean = -0.16, 95% CI = 0.34 to -0.67). Similarly, the Cronbach alpha and intraclass correlation coefficient between HbA and HbIC also revealed that both for single measure and average, the values were higher between HbA and HbIC being 0.703 and 0.825 as compared to the values of 0.200 and 0.333 between HbA and HbICX. Comparing these results of the tests of agreement with the sensitivity and specificity of the present study, it seems obvious that HbIC is a reliable and accurate test for Hb estimation in cattle blood using DBS.
Summing up, the present study concludes that the indirect cyanmethemoglobin method for Hb estimation is reliable and accurate for cattle blood, if a measured quantity of blood drop is taken on a filter paper. Furthermore, if a standardized 5mm punch is holed in the filter paper having the DBS, then a correction factor (Hb=0.12(HbICX)+7.4) attained from the regression prediction equation of present study between HbA and HbIC could be implied for accurate results. We recommend this DBS technique for Hb estimation in cattle blood for resource-poor settings and for livestock herds being reared distantly from the laboratories. For future, it is recommended that DBS technique with various other modifications and for other hematochemical biomarkers may be validated for livestock blood.
Author Contributions
All the authors contributed equally.
The author declare that there is no conflict of interest regarding the publication of this paper.
![]() References
References
- Katiyatiya CL, Muchenje V, Mushunje A. Seasonal variation in coat characteristics, tick loads, cortisol levels, some physiological parameters and temperature humidity index on Nguni cows raised in low- and high-input farms. International Journal of Biometeorology, (2015); 59: 733-743.
- Qayyum A, Farooq U, Samad H, Chauhdry H. Prevalence, clinicotherapeutic and prophylactic studies on theileriosis in district Sahiwal (Pakistan). Journal of Animal and Plant Sciences, (2010); 20: 266-70.
- Turkson P-K, Ganyo EY. Relationship between haemoglobin concentration and packed cell volume in cattle blood samples. Onderstepoort Journal of Veterinary Research, (2015); 82: 1-5.
- Ahmad S, Farooq U, Lashari MH, Idris M, Ur-Rehman Z, Khan N, Hameed S. Devising and validating a pen-side hematological formula for hemoglobin estimation in Cholistani cattle. Tropical Animal Health and Production, (2022); 54: 377.
- Srivastava T, Negandhi H, Neogi SB, Sharma J, Saxena R. Methods for hemoglobin estimation: A review of" what works. Journal of Hematology and Transfusion, (2014); 2: 1028.
- Agnihotri M, Ambad R, Rahule A. Study of evaluation of sensitivity and specificity of simple screening methods for assessment of anaemia in pregnant women. Journal of Contemporary Medicine in Dentistry, (2015); 3: 62-66.
- Toppo M, Pal DK, Gour D, Melwani V, Dubey M, Mishra A. Comparison of performance of digital Hemoglobinometer over automated hematology analyzer for hemoglobin estimation and its user-friendliness among the pregnant women in selected district hospitals of Madhya Pradesh. Indian Journal of Community Medicine, (2019); 44: 31.
- Barduagni P, Ahmed AS, Curtale F, Raafat M, Soliman L. Performance of Sahli and colour scale methods in diagnosing anaemia among school children in low prevalence areas. Tropical Medicine International Health, (2003); 8: 615-618.
- Kapoor S, Kapil U, Dwivedi SN, Anand K, Pathak P, Singh P. Comparison of HemoCue method with cyanmethemoglobin method for estimation of hemoglobin. Indian Pediatrics, (2002); 39: 743-746.
- Samsonova JV, Saushkin NY, Osipov AP. Dried Blood Spots technology for veterinary applications and biological investigations: technical aspects, retrospective analysis, ongoing status and future perspectives. Veterinary research communication, (2022); 46: 655-698.
- Saushkin NY, Samsonova J, Osipov A, Kondakov S, Lysova E, Elizarova I. Strip-dried biofluids for the detection of specific antibodies in small, infected ruminants. Moscow Univeristy Chemistry Bulletin, (2018); 73: 135-137.
- Sun D, Cho Y-I, Comyn P, Yoon K-J. Use of blood collected onto and dried on filter paper for diagnosing pregnancy in cattle. Veterinary Journal, (2013); 198: 494-497.
- Guthrie R, Susi A. A simple phenylalanine method for detecting phenylketonuria in large populations of newborn infants. Pediatrics, (1963); 32: 338-343.
- Mei JV, Alexander JR, Adam BW, Hannon WH. Use of filter paper for the collection and analysis of human whole blood specimens. Journal of Nutrition, (2001); 131: 1631S-6S.
- Stachanow V, Neumann U, Blankenstein O, Bindellini D, Melin J, Ross R, Exploring dried blood spot cortisol concentrations as an alternative for monitoring pediatric adrenal insufficiency patients: A model-based analysis. Frontiers in Pharmacology, (2022); 13: 819590.
- Domínguez-Menéndez G, Cifuentes L, González C, Lagos M, Quiroga T, Rumié H, Growth hormone of dried blood spot for the diagnosis of growth hormone deficiency. Reviews in Child Podiatry, (2019); 90: 145-151.
- Edelbroek PM, van der Heijden J, Stolk LM. Dried blood spot methods in therapeutic drug monitoring: methods, assays, and pitfalls. Therapeutic Drug Monitoring, (2009); 31: 327-336.
- Nichols BE, Girdwood SJ, Shibemba A, Sikota S, Gill CJ, Mwananyanda L. Cost and impact of dried blood spot versus plasma separation card for scale-up of viral load testing in resource-limited settings. Clinical Infectious Diseases, (2020); 70: 1014-1020.
- García-Cisneros S, Sánchez-Alemán MÁ, Conde-Glez CJ, Lara-Zaragoza SJ, Herrera-Ortiz A, Plett-Torres T. Performance of ELISA and Western blot to detect antibodies against HSV-2 using dried blood spots. Journal of Infections and Public Health, (2019); 12: 224-228.
- Bansal PG, Toteja GS, Bhatia N, Gupta S, Kaur M, Adhikari T. Comparison of haemoglobin estimates using direct & indirect cyanmethaemoglobin methods. Indian Journal of Medicine Research, (2016); 144: 566.
- Skogstrand K, Thorsen P, Nørgaard-Pedersen B, Schendel DE, Sørensen LC, Hougaard DM. Simultaneous measurement of 25 inflammatory markers and neurotrophins in neonatal dried blood spots by immunoassay with xMAP technology. Clinical Chemistry, (2005); 51: 1854-1866.
- Mulenga GM, Namangala B, Chilongo K, Mubamba C, Hayashida K, Henning L.Challenges in the diagnostic performance of parasitological and molecular tests in the surveillance of African trypanosomiasis in eastern Zambia. Tropical Medicine and Infectious Diseases, (2021); 6: 68.
- Samsonova J, Chadina A, Osipov A, Kondakov S, Makarova T, Komarov A. Detection of bovine leukemia virus by the polymerase chain reaction in dried blood spots using a membrane system of a new format. Moscow University Chemistry Bulletin, (2014); 69: 282-285.
- Saushkin NY, Samsonova J, Osipov A, Kondakov C, Efimova M, Chernov A. A new sampling format for the diagnostics of bovine infectious diseases in dried blood spots by ELISA. Moscow University Chemistry Bulletin, (2016); 71: 253-257.
- Farooq U, Samad H, Sher F, Asim M, Khan MA. Cholistan and Cholistani breed of cattle. Pakistan Veterinary Journal, (2010); 30: 126-130.
- Ahmad F, Gulzar F, Shirazi S, Farooq S, Ali Z. Agro-pastoral systems in Cholistan. Pakistan Geographical Reviews, (2005); 60: 65-69.
- Gupta A, Kapil U, Ramakrishnan L, Khenduja P, Yadav CP, Sofi NY. Validity of estimation of haemoglobin content in dried blood spot samples. Indian Journal of Hematology and Blood Transfusion, (2017); 33: 565-567.
- Sari M, Pee Sd, Martini E, Herman S, Bloem MW, Yip R. Estimating the prevalence of anaemia: a comparison of three methods. Bulletin of world health organization, (2001); 79: 506-511.
- Prodanović R, Nedić S, Radanović O, Milićević V, Vujanac I, Bojkovski J. Occurrence of neonatal diarrhea in calves with iron-deficiency anemia. Veterinarski Glasnik, (2019); 73: 1-9.
- Bland JM, Altman DG. Measuring agreement in method comparison studies. Statistical Methods in Medical Research, (1999); 8: 135-160.
- Gerke O. Nonparametric limits of agreement in method comparison studies: a simulation study on extreme quantile estimation. International Journal of Environmental Research and Public Health, (2020); 17: 8330.
- Shieh G. Assessing agreement between two methods of quantitative measurements: exact test procedure and sample size calculation. Statistics in biopharmaceutical research, (2020); 12: 352-359.
- Toteja G, Singh P, Dhillon B, Saxena B, Ahmed F, Singh R. Prevalence of anemia among pregnant women and adolescent girls in 16 districts of India. Food and Nutrition Bulletin, (2006); 27: 311-315.
- Katakura K, Lubinga C, Chitambo H, Tada Y. Detection of Trypanosoma congolense and T. brucei subspecies in cattle in Zambia by polymerase chain reaction from blood collected on a filter paper. Parasitology Research, (1997); 83: 241-245.
This work is licensed under a Creative Commons Attribution-Non Commercial 4.0 International License. To read the copy of this license please visit: https://creativecommons.org/licenses/by-nc/4.0