

Full Length Research Article
Possible correlations between SH2B3 rs2078863 gene polymorphism, lifestyle, food habits and nutritional intake of Minangkabau females with hypertension
Dita Hasni1,2, Cimi Ilmiawati3, Firdawati Firdawati4, Nur Indrawaty Lipoeto5*
Adv. life sci., vol. 10, no. 4, pp. 609-618, December 2023
*– Corresponding Author: Nur Indrawaty Lipoeto (indralipoeto@med.unand.ac.id)
Authors' Affiliations
2. Department of Pharmacology, Faculty of Medicine, Baiturrahmah University, Padang – Indonesia
3.Department of Pharmacology, Faculty of Medicine, Universitas Andalas, Padang – Indonesia
4.Department of Public Health Sciences, Faculty of Medicine, Universitas Andalas, Padang – Indonesia
[Date Received: 19/07/2023; Date Revised: 17/12/2023; Date Published Online: 31/12/2023; Date Updated:09/09/2025]
Abstract![]()
Introduction
Methods
Results
Discussion
References
Abstract
Background: Hypertension is the commonest cardiovascular risk factor and a leading cause of death worldwide. Several genetic variants are known to be involved in the pathogenesis of this disease. this study aimed to determine the relationship between the SH2B3 rs2078863 gene variants and hypertension in Minangkabau women.
Methods: In total, 190 women aged 18-45 years participated in this study. Patient data, including weight, height, Body Mass Index (BMI), and blood pressure examinations, were collected, and interviews regarding their nutrient intake and physical activity were assessed with the Semi-Quantitative Food Frequency Questionnaire (SQ-FFQ) and the Global Physical Activity Questionnaire (GPAQ) questionnaires. Blood was collected from peripheral veins, followed by DNA isolation and genotyping examination using the Kompetitive Allele Specific PCR (KASP) method.
Results: TT genotype in SH2B3 rs2078863 was observed to be more at risk of suffering from hypertension compared to the CC+CT genotype (ꭓ2 (1, n=190)=8.442, p=.004, phi=.21, OR=2.48). The regression logistic analysis revealed the role of obesity, low physical activity, and age as risk factors for hypertension in the studied population (p<0.05).
Conclusion: The SH2B3 gene variant and lifestyle factors related to obesity and low physical activity increase the risk of hypertension.
Keywords: Hypertension; Minangkabau; SH2B3; Women
Introduction![]()
Hypertension is the most common cardiovascular risk factor and a leading cause of death worldwide. Hypertension (HTN) is currently defined as systolic blood pressure (SBP) values of 130 mmHg or more and/or diastolic blood pressure (DBP) values of 80 mmHg or more [1]. A study of the North American population showed that 33.5% of adults generally suffer from hypertension [2]. In 2018, Indonesian Basic Health Research reported the prevalence of this disease in the Indonesian population aged ≥ 18 years to be 34.1%, increasing from 25.8% and 31.7% in 2007 and 2013, respectively [3]. In West Sumatra, hypertension ranked first among non-communicable diseases, with a prevalence of 22.2% [4]
In the American adult population, hypertension is more common among men than women; the prevalence increases in women with advanced age. [5]. In comparison, the prevalence is close to 50% in the minority population of African Americans and Hispanic women. Among those over 60 years old, the prevalence becomes higher in women than in men, and this gap widens due to aging factors associated with the majority of elderly women, ease of access to medicines, ethnicity, and polycystic ovarian syndrome. [6]. Hypertension contributes to approximately one in five deaths among women in the United States (USA); therefore, it is a more challenging disease in women than in men. [7]. In Indonesia, the incidence of hypertension is higher among women (36.9%) than among males (31.3%) in the over-18 population. [3].
The main problem is the “unknown” cause of hypertension; 95% of all cases are idiopathic, often known as essential hypertension. [1], which is a multifactorial disorder involving the interaction of several genes and environmental factors. Essential hypertension has irreversible risk factors involving age, gender, and genetics. Modifiable risk factors include sodium intake.[8], physical activity[9], and obesity[10], as well as vehicle and cigarette smoke pollution [11]. As age increases, the hypertension risk doubles due to Insufficient endothelium integrity, shear stress, calcification, and autonomic abnormalities.[12] . Nutrient intake, such as high sodium intake and low potassium, is also a risk factor for hypertension.[13] . Excessive salt intake can cause some adverse effects, including microvascular endothelial inflammation, anatomical remodeling, and functional abnormalities. And low potassium intake will increase sodium reabsorption and can trigger fluid retention and increase stroke volume. [14]. Potassium intake can be obtained from fruits and vegetables. In Indonesia, fruit and vegetable consumption data is less than 95.5% of the Indonesian population, even in West Sumatra, this figure reaches 97.2% [3].
Lower physical activity is a severe worldwide problem, including in Indonesia. Based on the basic health research report, in Indonesia, the lower physical activity was 26.1% of the adult population, even in West Sumatra, reaching 40.3% in 2018 [3]. The mechanism of low physical activity with hypertension is associated with endothelial dysfunction and obesity.[9]. 65–75 percent of the risk for primary (essential) hypertension in humans is attributed to obesity[15]. The relationship between obesity and hypertension may be associated with several pathways, namely, insulin. [16], sympathetic activity [17], leptin [18], decreasing natriuretic peptides with consequent disturbances in salt excretion [19], and the renin–angiotensin–aldosterone system (RAAS) [20,21]. In the adult population in Indonesia, the prevalence of obesity tends to increase from 10.5% in 2007 to 14.8% in 2013 and 21.8% in 2018 [3]. Hypertension occurs due to the interaction of these various risk factors; in other words, one risk factor alone is not enough to be the leading cause. In nine out of ten hypertension patients, the interaction between genetic and environmental risk factors elevates the risk of the disease. [22]. Approximately 20%–40% of the variation in blood pressure among the general population is determined by genetic factors [23]. The Minangkabau culture in Indonesia is of special significance since it has the biggest matrilineal system of kinship in the world, in which women have more authority in both family and community.[24] . Food supply is concentrated on women in the Minangkabau community, and significant evidence indicates a relationship between nutrition and lifestyle and hypertension.[25]Consequently, it is crucial to comprehend women’s eating habits, lifestyle, and genetic vulnerability to the condition. GWAS has linked the SH2B3/LNK gene to hypertension and renal failure in humans [26,27]. Sex-specific association of SH2B3 and SMARCA4 polymorphisms with diabetic and nutritional disorders is documented by Ji et al. [27] in the Chinese Han population and by Nikitin et al. [28] in the Russian population. These findings are not well studied in Indonesian ethnical groups, whereas it seems to be in relation to ethno-genetic background, especially for females [27,28].
The SH2B3 gene, located on chromosome 12 (12q24), encodes the SH2B3 protein, which plays a role in the regulation of cytokine signaling [29]. Genetic variation in this gene is associated with hypertension [30], renal impairment [31], blood lipid [32], and diabetes mellitus [33]. The SH2B3 rs2078863 polymorphism causes a T>C nucleotide substitution in the upstream intron region, resulting in a decrease in SH2B3 protein expression. The loss of SH2B3 induces severe inflammation in renal and vascular tissues as well as an increase in IFNg production by dendritic cells and T lymphocytes. SH2B3 in dendritic cells may control the equilibrium between proinflammatory Th1/Tc1 cells and anti-inflammatory Treg cells. IFNg probably mediates, at least partially, the effect of LNK deficiency on hypertensive end-organ damage [29,34]
Previous studies have shown a relationship between the SH2B3 rs2078863 gene variant and risk factors for the incidence of hypertension, but none involve Minangkabau women. Therefore, this study aimed to determine the association of the SH2B3 rs2078863 gene variant with hypertension in Minangkabau women.
Methods![]()
Sample Size Calculation
To calculate the sample size required in this study, we used the power and Sample Size Program version 3.1.2 [35]. This study was a case study and an independent control with one control per case. Previous data showed that the T allele of the SH2B3 rs2078863 in the control was 0.49 [34]. Suppose the actual chance ratio for hypertension in exposed subjects relative to unexposed subjects is 2.5. In that case, we need to study 80 hypertensive women patients and 80 non-hypertensive women to be able to reject the null hypothesis that this chance ratio was equal to 1 with a probability (power) of 0.8. The likelihood of a Type I error associated with testing this null hypothesis is 0.05. We use uncorrected chi-squared statistics to evaluate this null hypothesis.
Study Participant
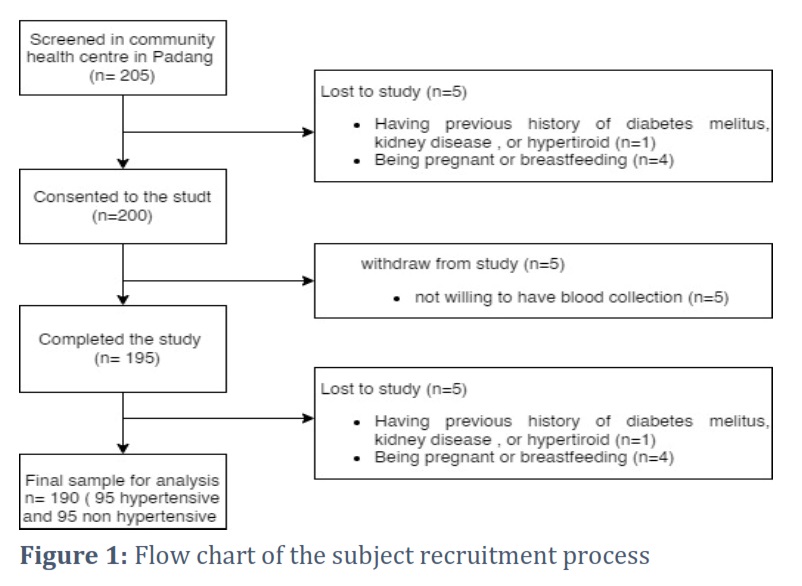
Two hundred and five women were recruited from the community health center in Padang City, West Sumatra. Participants were recruited using the consecutive sampling method after meeting the inclusion and exclusion criteria. Inclusion criteria were healthy women and hypertensive women (between 18 and 45 years old) with Minangkabau ethnicity, i.e., their mother and grandmother are Minangkabau without intermarrying with other tribes. Among the 205 eligible adults, five adults were excluded from the study. Exclusion criteria included the following: having a previous history of type 2 diabetes, kidney disease, and hyperthyroid (n=1), being pregnant or lactating (n=4). Among the 200 remaining adults, five volunteers did not undergo blood sample collection. The sample consisted of 195 women who completed an SQ-FFQ, GPAQ, and underwent blood sample collection for genetic analysis. Among 195 participants, five samples had missing data during genotyping analysis. So the final sample conducted by the analysis was 190 women, 95 hypertensive women, and 95 non-hypertensive women. All participants provided written informed consent before participating. Participants were allowed to leave the study at will and drop out of any of the procedures. The study was approved by the ethical review committee of the Medical Faculty, Universitas Andalas (No. 491/UN.16.2/KEP-FK/2021).
Anthropometric and Blood Pressure Measurements
Body weight was measured to the nearest 100 g using an electronic scale (Digital body scales EB-1613 H OneMed, Indonesia), and height was measured to the nearest mm using a stadiometer (microtoise) (OneMed Medicom stature meter, YF.05.05.V.A.1022, Indonesia). The height was measured with the head in the horizontal plane and heels together in a standing posture. Body mass index (BMI) was calculated as weight in kilograms divided by height in meters squared (kg/m2) and categorized into non-obese and obese groups. According to the weight criteria for Adults in the Asia Pacific, Subjects with a BMI < 25 kg/m2 were classified as non-obese, and those with a BMI of > 25 kg/m2 were obese. [36].
Blood pressure was measured using a 3-series Upper arm Blood Pressure Monitor (Model BP7100, Omron® UK), with the participants in a sitting position. Based on the ACC/AHA Hypertension Guidelines, systolic and diastolic blood pressure levels above 130/80 mmHg are categorized as hypertensive, and those equal to or below 130/80 mmHg are categorized as non-hypertensive [37]. Those subjects who were diagnosed with hypertension by a general practitioner and had blood pressure less than or equal to 130/80 mmHg due to antihypertensive treatment were categorized as the hypertensive group.
Measurement of physical activity
Physical activity was measured through interviews using the Global Physical Activity Questionnaire (GPAQ) [38]. The interview data were then converted into “The metabolic equivalent of task (MET) units” per week. Data on the duration of activities in the high- and medium-intensity categories were multiplied by MET coefficients of 8 and 4, respectively. The converted data were subsequently grouped according to high, medium, and low criteria. After obtaining the total value of physical activity in MET units of minutes/week, the subjects were grouped based on the three levels of physical activity, namely, high (MET ≥ 3000), medium (3000>MET≥600), and low (MET <600)[39].
Assessment of nutrient intake
Food intake was assessed by a qualified nutritionist using a previously validated and published Semi-Quantitative Food Frequency Questionnaire (SQ-FFQ) containing 223 food items, which Lipoeto developed. [40]. In addition, it has been used in a previous study. [41,42] . The SQ-FFQ was adapted to Minangkabau food habits; Minangkabau is an ethnic group in West Sumatra, Indonesia. The participants were asked to estimate the frequency (number of times per day, week, or month) and portion sizes of variety foods. It used portion-size photographs of all relevant foods to estimate portion-size intake. The data were then analyzed using Nutritional Epidemiology (EpiNu) software to estimate macronutrient intake and total daily energy. [43].
Blood Collection and SNP Genotyping Analysis
Phlebotomy is utilized to withdraw blood from peripheral veins. Before deoxyribonucleic acid (DNA) extraction, blood samples were collected and stored at -20°C in tubes containing ethylenediaminetetraacetic acid (EDTA). DNA extraction from whole blood using a PureLinkTM Genomic DNA Mini Kit (Invitrogen, Thermofhiser®, Massachusetts), following the manufacturer’s instructions. The DNA concentration was determined using a NanoDrop spectrophotometer. Genotyping was performed at LGC Genomics (http://www.lgcgroup.com/services/ genotyping), which employs the competitive allele-specific PCR-KASP® assay. The KASPTM genotyping technology utilized in this study has been evaluated as accurate to greater than 99.8 percent. Validation of the KASPTM genotyping was performed at LGC Genomics, and the project manager confirmed the quality of the genotyping results.[44] .
Statistical Analysis
The normality test was carried out statistically (Shapiro–Wilk and Kolmogorov–Smirnov tests) and graphically (histograms, Q–Q plots, and box plots). If the results were abnormal, data transformations were performed, and the normality was reassessed. If the results remained abnormal, an alternative statistical test was conducted. The numerical data were calculated as averages and standard deviations for normally distributed data (height, weight, body mass index, blood pressure, calorie intake, carbohydrates, proteins, fats, sodium, and potassium) and as median and range values for non-normally distributed data; frequencies and percentages were determined for categorical data (occupation, obesity, physical activity, smoking history, alcohol, and SH2B3). Chi-squared tests were conducted to investigate the relationship of the SH2B3 rs2078863 gene variant with hypertension. Furthermore, multivariate logical regression tests were carried out to assess the association of SH2B3 gene variants with hypertension by making adjustments to other parameters. The model selected age, obesity, physical activity, caloric intake, and carbohydrate intake as the contributing factors based on the significance of the bivariate statistical test with hypertension (P< 0.25).
Results![]()
Demographic, Clinical Characteristics, and Food Intake of Non-Hypertensive and Hypertensive Groups
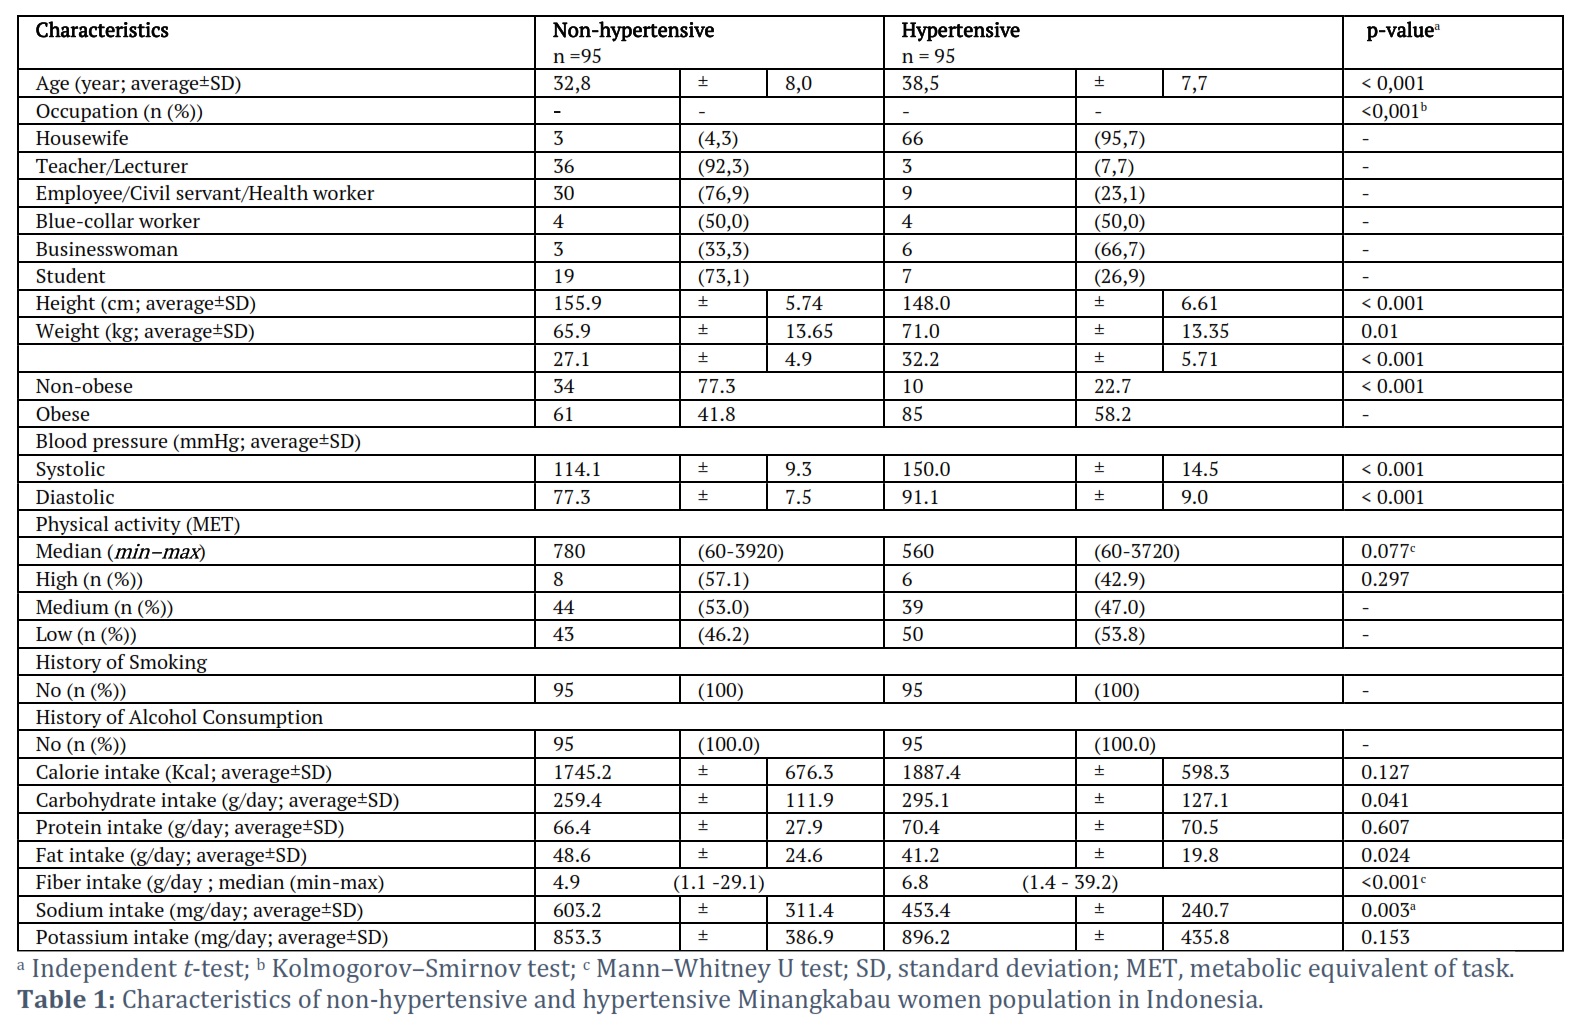
In Table 1, significant differences were found in age, occupation, height, weight, BMI, and systolic and diastolic blood pressure between the non-hypertensive and hypertensive groups (P<0.05). No differences were observed in physical activity between the non-hypertensive and hypertensive groups because most of the subjects had low levels of physical activity. However, statistically, the average MET values appeared to differ between the groups. Differences were also observed in carbohydrate intake between the groups: the hypertensive group consumed more carbohydrates and fiber than the non-hypertensive group. Additionally, the non-hypertensive group had a higher intake of sodium and potassium than the hypertensive group. In contrast, the calorie, protein, and potassium data showed no differences between the two groups. The hypertension group had a higher fiber intake, potassium intake, and fat intake, as well as a lower sodium intake than the non-hypertensive group, because some of them had made lifestyle modifications related to their diseases. In general, both groups have a low average intake of potassium and fiber from the guidelines for nutritional adequacy figures set by the Indonesian government. A low fiber intake, high sodium intake, low potassium intake, and high fat intake are characteristic of Minangkabau ethnic cuisine. In this study, data on fiber, sodium, potassium, and fat intakes were not continued for multivariate analysis because lifestyle modifications made by some participants would have impacted the research bias.
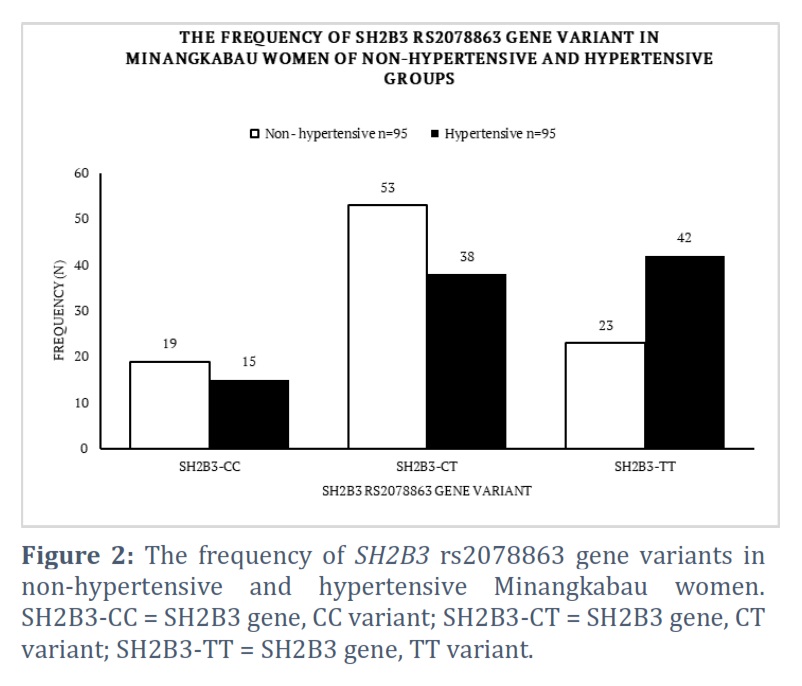
Distribution of SH2B3 Gene Variants in Non-Hypertensive and Hypertensive Groups
In this study, the hypertensive group had more frequent SH2B3-TT variants than the non-hypertensive group; however, the CC and CT variants were not significantly different between the two groups (Figure 2).
In Table 1, significant differences were found in age, occupation, height, weight, BMI, and systolic and diastolic blood pressure between the non-hypertensive and hypertensive groups (p<0.05). No differences were observed in physical activity between the non-hypertensive and hypertensive groups since most of the subjects had low physical activity. However, statistically, the average MET values appeared to differ between the groups. Differences were also observed in carbohydrate intake between the groups: the hypertensive group consumed more carbohydrates and fiber than the non-hypertensive group. Additionally, the non-hypertensive group had a higher intake of sodium and potassium than the hypertensive, while the calorie, protein, and potassium data showed no difference between the two groups. The hypertension group has a higher fi-Ber, potassium intake, and fat intake, as well as a lower sodium intake than the non-hypertensive group because some of them have made lifestyle modifications related to their diseases. The low fiber intake, high sodium, and high fat intake are the characteristics of Minangkabau ethnic cuisine.
Association of SH2B3 rs2078863 Gene Variants with Hypertension
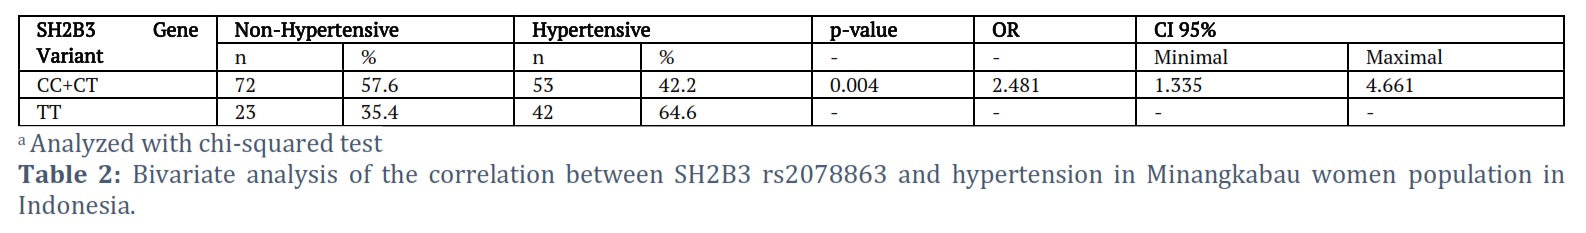
Based on the results detailed in Table 2, A chi square group difference between SH2B3 genotype and hypertension indicated a significant association of medium effect (ꭓ2 (1, n=190)=8.442 p=.004, phi=.21). More women with SH2B3 TT genotype were suffer hypertension compared to women with CC+CT genotype (64,6% versus 42.4%), while more women with SH2B3 CC+CT genotype were not suffering hypertension (57.6% versus 35.4%). After that, we can calculate the power size in this study. a statistical association was found between SH2B3 rs2078863 and the incidence of hypertension, characterized by a p < 0.05. This study included 95 women with hypertension and 95 non-hypertensive women. Non-hypertensive patients exhibiting the TT variant were 0.354; the true odds ratio for hypertension in the high-risk group relative to the CC+CT group was 2.481. The type 1 error probability associated with this test was 0.05; thus, the power of this study was 0.873.
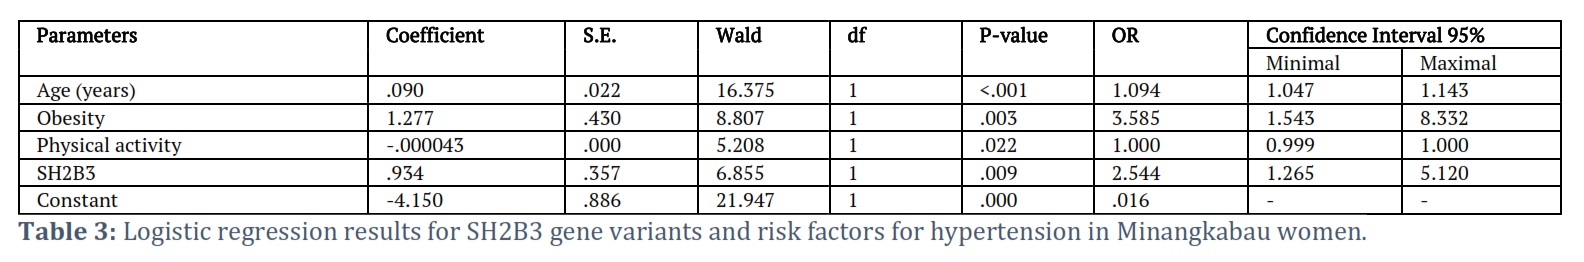
SH2B3 rs2078863 with Other Hypertension Risk Factors
As shown in Table 3, a correlation was observed between SH2B3 gene variants and hypertension. Statistically, the logistic regression was characterized by a p-value of 0.04 and an OR of 2.134 (IK95% 1.035 – 4.401). Several other risk factors for hypertension are age, obesity, and low levels of physical activity.
Based on Table 3, age, obesity, SH2B3, and physical activity were found to be associated with hypertension. The strongest correlation was observed between obesity and SH2B3.
From the logistic regression analysis, the following equation was obtained:
Y = Constant + a1x1+a2x2+…….+aixi
Y= -4.150 +.090 (year)+ 1.277 (obese) +(-.000043)(Physical activity) + .934(SH2B3)
Where “year” is the entered age number; a value of 1 indicates obese, and a value of 0 indicates not obese; “Physical activity” is the entered MET value based on physical activity data; a value of 1 indicates SH2B3-TT, and a value of 0 indicates SH2B3-CC+CT. The probability of hypertension in Minangkabau women was calculated using the following formula. [46]:
![]()
For example, if a 31-year-old Minangkabau woman exhibited the SH2B3-TT variant (i.e., obese, with a daily MET value of 500 MET/day, her probability of suffering from hypertension can be calculated by using the following equation:
Y= -4.150 +.090 (year)+ 1.277 (obese) +(-.000043)(MET) + .934(SH2B3)
Y = -4.150 + .090 (31) + 1.277 (1) +(-.000043)(500) + .934(1)
Y= 0,8295
Thus, the probability is = ![]() 0,696.
0,696.
This means the probability of hypertension in this individual is 69.6%. The above equation was validated in terms of discrimination and calibration. The calibration value was determined with the Hosmer–Lemeshow test, with a p-value >0.05, meaning that it had good calibration [45,46].
Figures & Tables
Hypertension is the leading cause of cardiovascular morbidity and mortality worldwide; it affects a third of the adult population in the USA[47] . This study found a correlation between the SH2B3 gene rs2078863 and hypertension in Minangkabau women.
This finding is in line with a study in Finland, which found a relationship between the SH2B3 gene and the incidence of hypertension. Another study in China also linked the SH2B3 gene rs2078863 with coronary heart disease [17,31]. This locus was selected randomly. Therefore, further studies should be performed to verify the association. Furthermore, GWAS linked the SH2B3 gene (LNK) to hypertension and kidney disease. This gene encodes SH2B protein adapter 3 (SH2B3, LNK), an intracellular pathway that plays a significant role in hematopoiesis and cytokine signaling. From the N-terminal to the C-terminal, SH2B3 contains proline-rich interaction sites, the pleckstrin and Src homology domains (SH2), and many putative tyrosine phosphorylation sites [12].
The SH2B3 gene is located on chromosome 12 at 12q24, and a polymorphism of the SH2B3 gene 2078063 induces a change in the base of thymine to cytosine (T>C) in the intron area. This leads to substituted transcript variants in the intron; we hypothesize that it can decrease protein expression. Introns can affect transcription by storing regulatory elements such as enhancers and repressors [48]. In this variant gene, it is located in the genic upstream. Furthermore, this gene encodes the SH2B3/LNK protein, which plays a role in the pathogenesis of hypertension through inflammatory mechanisms. LNK protein deficiency in dendritic cells (DCs) can lead to the increased polarization of naïve T cells into interferon gamma (IFNG), thereby producing T cells, specifically CD8 T cells, which cause the accumulation of CD8 T cells in the kidneys and blood vessels. Increased inflammation and IFNG production lead to a rise in sodium reabsorption, superoxide production, and albuminuria in the kidneys. This also decreases the nitric oxide and endothelial-dependent relaxation disorders of blood vessels, and eventually triggers hypertension [49].
In experiments involving animals as subjects, mice lacking the LNK/SH2B3 protein exhibited an increase in the infiltration of monocytes/macrophages and T cells in the kidney. The loss of LNK/SH2B3 protein causes decreased nitric oxide levels and endothelium-related relaxation disorders in comparison to normal rats.[50] . According to additional studies, LNK/SH2B3 protein deficiency increases IFNG levels, and IFNG produces T cells, specifically CD8, which accumulate in the kidneys and can induce hypertension. [30]. Other studies linked genetic variations in SH2B3 to blood pressure and elevated levels of Beta-2 microglobulins, a well-characterized kidney filtration biomarker, likely leading to increased CD8+ T-cell activation and interferon-γ production, which promote hypertension and hypertensive end-organ damage. [51] .
CD8+ T cells play a role in hypertension; a study by Sun et al. demonstrated that these cells express the mineralocorticoid receptor (MR), and that this T cell receptor plays a significant role in systemic hypertension [52]. The MR, which is a nuclear protein, was found to complex with nuclear factor of activated T cells 1 (NFAT1) and with activator protein 1 (AP1) to promote IFNG production by CD8+ T cells; deletion of the MR receptor in T cells caused a significant decrease in Ang-II-induced hypertension and renal and vascular damage. In contrast, T cell MR overexpression exacerbated hypertension. Eplerenone, a commonly used antagonist of the MR receptor, inhibited IFN production by CD8+ T cells in hypertension. Another study focused on the role of the MR on epithelial cells of the distal kidney nephron in promoting sodium and volume retention; however, there is growing evidence that the MR has prohypertensive effects in other cells. One study revealed that the T cell MR plays a previously undefined role in hypertension. [53].
Deficiencies in this SH2B3 protein will increase the hypertensive-related inflammatory response by increasing the production of gamma interferon by dendritic cells and T cells, in particular CD8 T cells. It will result in a greater accumulation of T cells in the kidneys and blood vessels. Increased inflammatory response and IFNG production will result in an increase in sodium reabsorption, superoxide production in the kidneys, and a decrease in nitric oxide, which can lead to hypertension.
IFNG = interferon gamma; LNK = lymphocyte adapter protein; SH2B3 = SH2B adaptor protein 3.
It is known that hypertension is unlikely to occur if an inflammatory process is the sole cause. The presence of additional risk factors, such as a high salt intake or obesity, will constitute a "second hit”. In the presence of additional risk factors, genetic risk factors such as the SH2B3 gene polymorphism will increase the risk of hypertension.
In this study, after analyzing the logistic regression test with other hypertension risk factors, the SH2B3 was found to have an odds ratio of 2.481 (CI95% 1.335 – 4.661); other risk factors affecting the incidence of hypertension included obesity, age, and low physical activity. Moreover, the results revealed that obese individuals had a 3.585-fold greater risk of suffering from hypertension compared with their non-obese counterparts. Increased renal tubular sodium reabsorption affects pressure natriuresis and plays a significant role in the development of obesity-related hypertension. [54];
1) physical compression of the kidneys by fat in and around the kidneys[20] , 2) activation of the renin-angiotensin-aldosterone system (RAAS)[15], and 3) increased sympathetic nervous system (SNS) activity is the mediator of abnormal kidney function and increased blood pressure during the development of obesity hypertension [55]. Activity of the RAAS system is presumably influenced by renal compression and SNS activation. Obesity also activates mineralocorticoid receptors independently of aldosterone and angiotensin II [56]. Leptin and brain melanocortin system activation are necessary for SNS activation in obesity.[56].In this study obesity was also influenced by carbohydrate intake, it was found 42 percent of our participants had a carbohydrate intake of 319 g and more per day, Based on the average caloric intake of our participants (1816 kcal/day), this equivalent to a 70.2% carbohydrate consumption, which is much higher than the Indonesian dietary recommendations, which suggest deriving 50% of total energy from carbs [58,59].
Age-related increases in blood pressure are considered to be a universal factor involved in human aging [60]. The physiological changes associated with aging lead to elevations in systolic blood pressure, average arterial pressure, and pulse pressure, as well as a decrease in the ability to respond to sudden hemodynamic changes [61]. The increase in blood pressure observed with aging is most likely related to arterial changes. Aging leads to narrowing of the blood vessel lumen and hardening of the vessel walls through a process known as atherosclerosis [62]. Particularly, endothelial dysfunction associated with aging would contribute to the etiology, maintenance, and progression of atherosclerosis. Endothelial dysfunction is the early stage of atherosclerosis and contributes to its progression [12]. Age-related endothelial dysfunction is caused by an imbalance between nitric oxide (NO) and reactive oxygen species (ROS), in addition to a reduction in the number of endothelial progenitor cells (EPCs) in the bone marrow or inhibition of EPC mobilization [61,63]. In women, age factors are also associated with menopause. Known hormonal changes play a role in increasing the risk of hypertension in women [64,65].
The so-called "disuse syndrome" is the outcome of physical inactivity (i.e., premature aging, obesity, cardiovascular vulnerability, musculoskeletal fragility, and depression) [66] This study confirmed the protective effects of physical activity against hypertension by correlating a low level of physical activity with the prevalence of hypertension. Typically, physical activity is recommended as a crucial lifestyle modification that may aid in the prevention of hypertension. Physical activity activates adaptive mechanisms, including the enhancement of endothelial function and NO production, the induction of pro-angiogenic pathways, and the enhancement of insulin sensitivity. These mechanisms result in a substantial decrease in blood pressure. [67]. In addition to working outside the home, women typically perform housework. Household activities, such as cooking, shopping, and gardening, can increase overall physical activity. Certain physical activities, such as aerobic training, can increase the level of endorphins in the female central nervous system, promote adaptive changes in the hypothalamic–pituitary–ovarian axis, and stimulate the production of estrogen in the body’s secretions. Estrogen is an essential hormone for the body’s metabolism of substances and energy. According to various studies, a woman’s estrogen deficiency is closely associated with abdominal obesity, insulin resistance, and related diseases. [9].
In this study, low fiber and potassium intake were found in all participants. For fiber, 4.9 g/day for the non-hypertensive group and 6.8g/day for the hypertensive group, and potassium, 603 mg/day for the non-hypertensive group and 453 mg/day for the hypertensive group. With an average intake value lower than the nutritional adequacy value set by the government (30-32 g/day for fiber and 4700 mg/day for potassium [59]. Minangkabau ethnic cuisine, which is low in fiber, low in potassium, high in sodium, and high in fat, is an environmental risk factor for suffering from hypertension. Potassium has natriuretic and diuretic actions, and hence has the ability to reduce blood pressure. In a sodium-dependent diet, potassium deficiency led to sodium and water retention, reduced urine sodium excretion, elevated blood pressure, and salt sensitivity. [68].
It is generally established that genetic or environmental risk factors alone are unable to explain the complexity of hypertension disease's etiology. [69]. Gene-environment interactions have a crucial role in the aetiology of complex disorders. [70], as has been shown in previous discussion. Specific SNPs may alter the effect of environmental variables on complicated illnesses, and vice versa. Evaluation of gene-environment interactions may increase the prediction capacity of phenotypes, find novel genetic profiles based on ecological variables, improve understanding of biological pathways and environmental influences, and facilitate comprehension of phenotypic variation. If data on SH2B3 genetic variation, age, physical activity, and body mass index are available, a model was developed in this research that may predict the vulnerability of a Minangkabau woman to suffer from hypertension.
Minangkabau women exhibiting the SH2B3-TT variant are genetically at higher risk of hypertension than SH2B3-CC and SH2B3-CT variants; however, lifestyle factors related to obesity and low physical activity also increase the disease risk. This study found that more than one-third of the participants consumed carbohydrate intake that exceeded 70% of their total calories; of course, this would increase the risk of obesity, accompanied by low physical activity and low fiber and potassium intake in the Minangkabau population. it would have an impact on improving the risk of hypertension related to gene-environment interaction.
Funding
This research was funded by the Baiturrahmah Education Foundation and Fundamental Skim Research Program of the Faculty of Medicine Andalas with Number 10/UN.16.02/Fd/PT.01.03/2021.
Institutional Review Board Statement
This study was conducted based on the Declaration of Helsinki and approved by the Institutional Review Board of Medical Faculty, Universitas Andalas (491/UN.16.2/KEP-FK/2021).
Informed Consent Statement
Informed consent was obtained from all the participants involved.
Acknowledgments
The authors are grateful to the patients for their participation in this study.
Conflict of Interest
The authors declare no conflict of interest.
D.H. and N.I.L. contributed equally to this study. N.I.L. conceptualized the study. D.H. carried out the investigation. D.H., C.I., N.I.L., F.F., and E.D. reviewed and edited the manuscript. F.F. and D.D performed the visualization and designed the methodology. D.H., C.I., F.F., D.D., E.D., and N.I.L. validated the results. All authors have read and agreed to the published version of the manuscript.
![]() References
References
- Arshad MI, Syed FJ. Essential hypertension, (2019). NCBI Bookshelf.
- Banegas JR, Gijón-Conde T. Epidemiology of hypertension. Hipertension y Riesgo Vascular, (2017); 34: 2–4.
- Ministry of Health Republic of Indonesia Main Results of Indonesian Basic Health Research 2018; Jakarta, (2018).
- Padang HO. Padang city health profile in 2017, (2017). Padang.
- Benjamin EJ, Blaha MJ, Chiuve SE, Cushman M, Das SR, Deo R, De Ferranti SD, Floyd J, Fornage M, Gillespie C. Heart disease and stroke statistics’2017 update: A report from the American Heart Association, (2017). Circulation.
- Abramson BL, Melvin RG. Cardiovascular risk in women: Focus on hypertension. Canadian Journal Cardiology, (2014); 30: 553–559.
- Mozaffarian D, Benjamin EJ, Go AS, Arnett DK, Blaha MJ, Cushman M, Das SR, Ferranti S, De Després JP, Fullerton HJ. Heart disease and stroke statistics-2016 update a report from the American Heart Association, (2016); 133: 38–48.
- Grillo A, Salvi L, Coruzzi P, Salvi P, Gianfranco P. Sodium intake and hypertension. Nutrients, (2019); 11(9):1970.
- Dun Q, Xu W, Fu M, Wu N, Moore JB, Yu T, Li X, Du Y, Zhang B, Wang Q, Duan Y, Meng Z, Tian S, Zou Y. Physical activity, obesity, and hypertension among adults in a rapidly urbanised city. International Journal of Hypertension, (2021) Article ID 9982562.
- Wang Q, Song X, Du S, Du W, Su C, Zhang J, Zhang X, Zhang B, Wang H. Waist circumference trajectories in relation to blood pressure and the risk of hypertension in chinese adults. Nutrients, (2022); 14: 5260.
- Welch E. Hypertension. Nurs Stand, (2003); 13: 45-53.
- Higashi Y, Kihara Y, Noma K. Endothelial dysfunction and hypertension in aging. Hypertension Research, (2012); 35(11): 1039–1047.
- Grillo A, Salvi L, Coruzzi P, Salvi P, Parati G. Sodium Intake and Hypertension. Nutrients, (2019); 11(9): 1970.
- Adrogue HJ, Madias NE. Sodium and potasium in pathogenesis of hypertension. New England Journal of Medicine, (2007); 356(19): 1966-1978.
- Hall JE, Mouton AJ, Da Silva AA, Omoto ACM, Wang Z, Li X, Do Carmo JM. Obesity, kidney dysfunction, and inflammation: interactions in hypertension. Cardiovascular Research, (2021); 117(8): 1859–1876.
- Landsberg L, Aronne LJ, Beilin LJ, Burke V, Igel LI, Lloyd-Jones D, Sowers J. Obesity-related hypertension: pathogenesis, cardiovascular risk, and treatment a position paper of The Obesity Society and the American Society of Hypertension. journal of Clinical Hypertension, (2013); 15(1): 14–33.
- Fardin NM, Oyama LM, Campos RR. Changes in baroreflex control of renal sympathetic nerve activity in high-fat-fed rats as a predictor of hypertension. Obesity, (2012); 20(8): 1591–1597.
- Rahmouni K. Obesity-associated hypertension: recent progress in deciphering the pathogenesis. Hypertension, (2014); 64(2): 215–221.
- Castro-Torres Y, Katholi RE. Natriuretic peptides, obesity and cardiovascular diseases. Revista da Associação Médica Brasileira, (2015); 61(1): 19-20.
- DeMarco VG, Aroor AR, Sowers JR. The pathophysiology of hypertension in patients with obesity. Nature Reviews Endocrinology, (2014); 10(6): 364–376.
- Te Riet L, Van Esch JHM, Roks AJM, Van Den Meiracker AH, Danser AHJ. Hypertension: renin-angiotensin-aldosterone system alterations. Circulation Research, (2015); 116(6): 960–975.
- Padmanabhan S, Caulfield M, Dominiczak AF. Genetic and molecular aspects of hypertension. Circulation Research, (2015); 116 (6): 937–959.
- Kunes J, Zicha J. The interaction of genetic and environmental factors in the etiology of hypertension. Physiology Research, (2009); 2: 33–41.
- Stark A. The matrilineal system of the minangkabau and its persistence throughout History: a structural perspective. Southeast Asia A Multidisciplinary Journal, (2013); 13: 1–13.
- Oparil S, Acelajado MC, Bakris GL, Berlowitz DR, Cífková R, Dominiczak AF, Grassi G, Jordan J, Poulter NR, Rodgers A, Whelton PK. Hypertension. Nature Reviews Disease Primers, (2018); 4: 18014.
- Levy D, Ehret GB, Rice K, Verwoert GC, Launer LJ, Dehghan A, Glazer NL, Morrison AC, Johnson AD, Aspelund T. Genome-wide association study of blood pressure and hypertension. National Genetic, (2009); 41(6): 677–687.
- Ji Y, Song Y, Wang Q, Xu P, Zhao Z, Li X, Wang N, Jin T, Chen C. Sex-specific association of SH2B3 and SMARCA4 polymorphisms with coronary artery disease susceptibility. Oncotarget, (2017); 8(35): 59397–59407.
- Nikitin AG, Lavrikova EY, Seregin YA, Zilberman LI, Tzitlidze NM, Kuraeva TL, Peterkova VA, Dedov II, Nosikov VV. Association of the polymorphisms of the ERBB3 and SH2B3 genes with type 1 diabetes. Molecular biology, (2010);44(2):228-232.
- Dale BL, Madhur MS. Linking inflammation and hypertension via LNK/SH2B3. Current Opinion in Nephrology and Hypertension, (2016); 25(2): 87–93.
- Rudemiller NP, Lund H, Priestley JRC, Endres BT, Prokop JW, Jacob HJ, Geurts AM, Cohen EP, Mattson DL. Mutation of SH2B3 (LNK), a genome-wide association study candidate for hypertension, attenuates dahl salt-sensitive hypertension via inflammatory modulation. Hypertension, (2015); 65(5): 1111–1117.
- Blass G, Mattson DL, Staruschenko A. The function of SH2B3 (LNK) in the kidney. American Journal of Physiology-Renal Physiology, (2016); 311(4): 682–685.
- Teslovich TM, Musunuru K, Smith AV, Edmondson AC, Stylianou IM, Koseki M, Pirruccello JP, Ripatti S, Chasman DI, Willer CJ. Biological, clinical and population relevance of 95 loci for blood lipids. Nature, (2010); 466(7307): 707–713.
- Barrett JC, Clayton DG, Concannon P, Akolkar B, Cooper JD, Erlich HA, Julier C, Morahan G, Nerup J, Nierras C. Genome-wide association study and meta-analysis find that over 40 loci affect risk of type 1 diabetes. Nature Genetic, (2009); 41(6): 703–707.
- Ji Y, Song Y, Wang Q, X P, Zhao Z, Li X, Wang N, Jin T, Chen C. Sex-specific association of SH2B3 and SMARCA4 polymorphisms with coronary artery disease susceptibility. Oncotarget, (2017); 8(35): 59397–59407.
- Dupont WD, Plummer WD. Power and sample size calculations. a review and computer program. Control Clinical Trials, (1990); 11(2): 116–128.
- Pan WH, Yeh WT. How to define obesity? evidence-based multiple action points for public awareness, screening, and treatment: an extension of asian-pacific recommendations. Asia Pacific Journal of Clinical Nutrition, (2008); 17(3): 370–374.
- Flack JM, Adekola B. Blood pressure and the new ACC/AHA hypertension guidelines. Trends in Cardiovascular Medical, (2020); 30(3): 160–164.
- Keating XD, Zhou K, Liu X, Hodges M, Liu J, Guan J, Phelps A, Castro-Piñero J. Reliability and concurrent validity of global physical activity questionnaire (GPAQ): a systematic review. International Journal Environment Research Public Health, (2019); 16(21): 4128.
- Mumu SJ, Ali L, Barnett A, Merom D. Validity of the global physical activity questionnaire (GPAQ) in bangladesh. BMC Public Health, (2017); 17(1): 650.
- Lipoeto NI, Agus Z, Oenzil F, Wahlqvist ML, Wattanapenpaiboon N. Dietary intake and the risk of coronary heart disease among the coconut-consuming minangkabau in West Sumatra, Indonesia. Asia Pacific Journal of Clinical Nutrition, (2004); 13(4): 377–384.
- Surendran S, Aji AS, Ariyasra U, Sari SR, Malik SG, Tasrif N, Yani FF, Lovegrove JA, Sudji IR, Lipoeto NI. Vimaleswaran KS. A nutrigenetic approach for investigating the relationship between vitamin B12 status and metabolic traits in Indonesian Women. Journal Diabetes Metabolism Disorder, (2019); 18(2): 389–399.
- Alathari BE, Aji AS, Ariyasra U, Sari SR, Tasrif N, Yani FF, Sudji IR, Lovegrove JA, Lipoeto NI, Vimaleswaran KS. Interaction between vitamin D-related genetic risk score and carbohydrate intake on body fat composition: a study in southeast asian inangkabau women. Nutrients, (2021); 13(2): 326.
- Sudha V, Radhika G, Sathya RM, Ganesan A, Mohan V. Reproducibility and validity of an interviewer-administered semi-quantitative food frequency questionnaire to assess dietary intake of urban adults in southern India. International Journal Food Science Nutrition, (2006); 57(7-8): 481–493.
- KASP Assays, PCR-Based Genotyping. LGC Biosearch Technologies Available online: https://www.biosearchtech.com/products/pcr-reagents-kits-and-instruments/pcr-probes-and-assays/kasp-genotyping-assays (accessed on 21 January 2023).
- Kleinbaum DG, Klein M. Survival Analysis a Self-Learning Text, (1996), Springer.
- Kleinbaum DG, Dietz K, Gail M, Klein M, Klein M. Logistic Regression, (2002), Springer.
- Mills KT, Stefanescu A, He J. The global epidemiology of hypertension. Nature Reviews Nephrology, (2020); 16: 223–237.
- Le Hir H, Nott A, Moore MJ. How introns influence and enhance eukaryotic gene expression. Trends Biochemical Science, (2003); 28: 215–220.
- Mori T, Iwasaki Y, Seki Y, Iseki M, Katayama H, Yamamoto K, Takatsu K, Takaki S. Lnk/Sh2b3 controls the production and function of dendritic cells and regulates the induction of IFN-γ–Producing T cells. Journal of Immunology, (2014); 193:1728–1736.
- Saleh MA, McMaster WG, Wu J, Norlander AE, Funt SA, Thabet SR, Kirabo A, Xiao L, Chen W, Itani HA. Lymphocyte adaptor protein LNK deficiency exacerbates hypertension and end-organ inflammation. Journal of Clinical Investigation, (2015); 125: 1189–1202.
- Keefe JA, Hwang SJ, Huan T, Mendelson M, Yao C, Courchesne P, Saleh MA. Madhur MS, Levy D. Evidence for a causal role of the SH2B3 -Β2M axis in blood pressure regulation: framingham heart study. Hypertension, (2019); 73: 497–503.
- Sun XN, Li C, Liu Y, Du LJ, Zeng MR, Zheng XJ, Zhang WC, Liu Y, Zhu M, Kong D. T-Cell mineralocorticoid receptor controls blood pressure by regulating interferon-gamma. Circulation Research (2017); 120: 1584–1597.
- Norlander AE, Madhur MS, Harrison DG. Correction: The immunology of hypertension. Journal of Experimental Medicine, (2018); 215: 719–719.
- Hall JE, do Carmo JM, da Silva AA, Wang Z, Hall ME. Obesity-induced hypertension. Circulation Research (2015); 116: 991–1006.
- Putra TR. The effects of obesity in the blood pressure elevation. Journal Majority, (2015); 4: 3.
- Hall JE, Do Carmo JM, Da Silva AA, Wang Z, Hall ME. Obesity-induced hypertension: interaction of neurohumoral and renal mechanisms. Circulation Research, (2015); 116: 991–1006.
- Lu SC, Akanji AO. Leptin, obesity, and hypertension: a review of pathogenetic mechanisms. Metabolism Syndome Relative Disorder, (2020); 18: 399–405.
- Usfar AA, Fahmida U. Do indonesians follow its dietary guidelines?-evidence related to food consumption, healthy lifestyle, and nutritional status within the period 2000-2010. Asia Pacific Journal of Clinical Nutrition, (2011); 20: 484–494.
- Ministry of Health Republic of Indonesia. The Indonesian Dietary Recommendation (AKG-Angka Kecukupan Gizi) Indonesia, (2019); 45.
- Gurven M, Blackwell AD, Rodriguez DE, Stieglitz J, Kaplan H. Does blood pressure inevitably rise with age?: longitudinal evidence among forager-horticulturalists. Hypertension, (2012); 60: 25–33.
- Sun Z. Aging, arterial stiffness, and hypertension. Hypertension, (2015); 65: 252–256.
- Singh JN, Nguyen T, Dhamoon AS. Physiology, blood pressure, age related changes, (2019); StatPearls Publishing.
- Buford TW. Hypertension and aging. Aging Research and Revew, (2016); 26: 96-111.
- Stachenfeld NS. Hormonal changes during menopause and the impact on fluid regulation. Reproduction Science, (2014); 21: 555-561.
- Shen L, Wang L, Hu Y, Liu T, Guo J, Shen Y, Zhang R, Miles T, Li C. Associations of the ages at menarche and menopause with blood pressure and hypertension among middle-aged and older chinese women: a cross-sectional analysis of the baseline data of the china health and retirement longitudinal study. Hypertension Research, (2019); 42: 730–738.
- Knight JA. Review physical inactivity associated diseases and disorders. Annals of Clinical Laboratory Science, (2012); 42: 320–337.
- Gambardella J, Morelli MB, Wang XJ, Santulli G. Pathophysiological mechanisms underlying the beneficial effects of physical activity in hypertension. Journal of Clinical Hypertension, (2020); 22: 291-295.
- Shantanam S. Potassium: friend or foe. Physiology and Behavior, (2018); 176: 139–148.
- Kim YK, Kim Y, Hwang MY, Shimokawa K, Won S, Kato N, Tabara Y, Yokota M, Han BG, Lee JH. Identification of a genetic variant at 2q12.1 associated with blood pressure in east-asians by genome-wide scan including gene-environment interactions. BMC Medical Genetic, (2014); 15: 1–8.
- Aschard H. A perspective on interaction effects in genetic association studies. Genetic Epidemiology, (2016); 40: 678–688.
This work is licensed under a Creative Commons Attribution-Non Commercial 4.0 International License. To read the copy of this license please visit: https://creativecommons.org/licenses/by-nc/4.0