Short Communication
A comparative analysis of machine learning approaches for plant disease identification
Hidayat ur Rahman, Nadeem Jabbar Ch*, SanaUllah Manzoor, Fahad Najeeb, Muhammad Yasir Siddique, Rafaqat Alam Khan
Adv. life sci., vol. 4, no. 4, pp. 120-126, August 2017
*- Corresponding Author: Nadeem Jabbar Ch (Email: nadeem.ch83@gmail.com)
Authors' Affiliations
Abstract![]()
Introduction
Methods
Results
Discussion
References
Abstract
Background: The problems to leaf in plants are very severe and they usually shorten the lifespan of plants. Leaf diseases are mainly caused due to three types of attacks including viral, bacterial or fungal. Diseased leaves reduce the crop production and affect the agricultural economy. Since agriculture plays a vital role in the economy, thus effective mechanism is required to detect the problem in early stages.
Methods: Traditional approaches used for the identification of diseased plants are based on field visits which is time consuming and tedious. In this paper a comparative analysis of machine learning approaches has been presented for the identification of healthy and non-healthy plant leaves. For experimental purpose three different types of plant leaves have been selected namely, cabbage, citrus and sorghum. In order to classify healthy and non-healthy plant leaves color based features such as pixels, statistical features such as mean, standard deviation, min, max and descriptors such as Histogram of Oriented Gradients (HOG) have been used.
Results: 382 images of cabbage, 539 images of citrus and 262 images of sorghum were used as the primary dataset. The 40% data was utilized for testing and 60% were used for training which consisted of both healthy and damaged leaves. The results showed that random forest classifier is the best machine method for classification of healthy and diseased plant leaves.
Conclusion: From the extensive experimentation it is concluded that features such as color information, statistical distribution and histogram of gradients provides sufficient clue for the classification of healthy and non-healthy plants.
Key words: SVM, Random Forest, HOG, Citrus, Sorghum
Introduction
Plant diseases can be precisely and accurately recognized through the images of plant leaves. Plant diseases are generally categorized in three major classes such as viral, bacterial and fungus [1]. Researchers have previously used image processing and computer vision techniques to identify plant diseases. Recent trends in the classification and segmentation of images use machine learning techniques. Machine learning techniques such as Support Vector Machines (SVM) [2], Artificial Neural Network (ANN) [3] and Random Forest [4] are the most widely used for image classification. In a study the author used probabilistic neural network (PNN) and SVM for evaluating “fruit grading system”, for measuring the quality attribute in lemon and guava [5]. The author demonstrated that SVM has better results comparatively to PNN. SVM has successfully distinguished infected potato, utilizing color as fundamental component [6]. For the classification of food items like wheat and rice ANN have been utilized [7]. The proposed ANN based methodology reported 90% accuracy in the characterization and classification of various food items as well. In ANN methodology was utilized for distinguishing the maize yield ailment, for example, brown stripe and stem borer [8]. Significant results have been achieved by utilizing basic color shades features through k-means clustering technique for apple crop problem such as Apple blotch, rod and scab [9]. K-Nearest Neighbor (KNN) and Adaptive-Bayes classifier with Gaussian Mixture Model (GMM) was utilized for classification of leaf spot disease brought by microscopic organisms, like bacteria etc., found in citrus leaves [10,11]. As high as 95.2% accuracy was achieved by minimum distance based classification for identification of leaf spot disease in citrus leaves by suing descriptor of circularity, eccentricity and aspect ratio [12]. In another study researchers have looked at the execution of different supervised classifiers, for example, KNN, Linear Discriminant Analysis (LDA) and Native Bayesian for the classification and identification of citrus ailment, for example, scab, greasy spot and melanoses [13]. The result demonstrated the supremacy of LDA classifier by showing 98.5% accuracy. For distinguishing rust infection in soybeans a manual threshold setting strategies was proposed earlier [14]. The proposed strategy use Hue, Saturation and Intensity (HSI) model with hyper-spectral imagery for segmentation of soybean disease. By the literature review, it is evident that crop disease identification based on images has been widely used. Algorithm such as image classification and image segmentation are mostly used for diseased plant identification. Identifying specific plant disease is very important and tiresome process in image processing and machine learning. Issues such as selection of appropriate classification algorithm, selection of proper feature set and dataset are the major issues. The last one such as selection of proper dataset is very crucial since dataset construction is cumbersome and tedious process. In this paper we have constructed our own dataset; details of the dataset are provided in the dataset section.
This paper presents a comparative analysis of machine learning algorithms such as SVM, Random Forest and Multilayer Perceptron (MLP). These algorithms are the current state of the art image classification algorithm. These algorithms are used to classify healthy and non-healthy plant leaves of sorghum, citrus and cabbage. For classification of these images rich features have been used. These features are constructed from the Red, Green and Blue (RGB) color model. Level of red, green and blue elements in a leaf is used as feature. Some statistical feature like standard deviation, max, min, RGB feature variance and lastly Histogram of Oriented Gaussian (HOG) are utilized for training of system.
Methods
Crop disease: Crop disease can be broadly classified into three categories namely, viral, fungal and bacterial. In this experimental setup three different crops have been used namely sorghum, citrus and cabbage which have been affected by viral, fungal and bacterial attack. In this section we briefly discuss the diseases. Common diseases in cabbage are caused by cutworms and leaf borers. Cutworms induce attack which cuts the leaf and changes the leaf color to reddish black. Color change occurs due to nutrient deficiency. Aphid, leaf canker and mold are the common pathogens found in citrus plant. Aphid transmit bacterial diseases which create small black pores on the leaf, leaf canker is mainly caused by bacterium Xanthomonas axonopodis which damages the leaf, while molds attack causes leaf dryness. Beside cabbage and citrus diseases, sorghum is affected by worm and bacterial attacks. Bacterial attack changes color of the leaf while viral attacks cuts the leaf. Figure 1 shows the leaves of healthy and damaged crops.
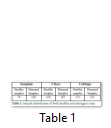
Dataset: The dataset used in this experiment is constructed by visiting the fields of sorghum, citrus and cabbage. The dataset consists of 382 images of cabbage, 539 images of citrus and 262 images of sorghum. Table.1 shows the distribution of sample plant leaves. Furthermore, dataset was partitioned in testing and training sets. The 40% data, 473 samples were utilized for testing and 60%, which consist of 710 samples were used for training.
Feature set: The performance of a machine learning algorithm can be enhanced by introducing rich feature set. In this experiment features such as color information, HOG and statistical distribution have been used. This section provides brief overview of the features used in this experiment.
Statistical distribution: Statistical features provide the statistics about the data distribution. Feature such as standard deviation, mean, maximum, minimum and median have been used in this experiment. The statistical features are calculated from the pixels obtained from the images. These features when combined with feature descriptors such as HOG and color information, much better performance was achieved.
Color information: Visual information provides sufficient clue for object discrimination. In this experiment RGB model is utilized for visual analysis. For each of the healthy and non-healthy image RGB pixels were extracted. With the addition of these pixels the future set were applied to the supervised classifier.
Histogram of Oriented Gradients (HOG): HOG is one of the techniques which are used in computer vision and image processing for object detection. HOG is a robust feature set used for object segmentation and identification [15]. The HOG technique consists of histogram of edge orientation and information about the shape [16]. HOG is obtained in such a way; firstly, the occurrence of edge in localized portion of the image is computed. After that local contrast normalization is used for improving accuracy. The image is divided into small areas called cell for each cell HOGs are calculated. In contrast normalization for more than 1 cell is aggregated. In the experiment window size of 128 cells was used for computing HOG descriptor.
Schemes of classification: The three different kinds of techniques for classification were utilized in this experiment, namely Support Vector Machine, Random Forest and supervised ANN which is also called Multi-Layer Perceptron. This area gives a brief outline of the classification techniques.
Random Forest: This classifier is widely used for image and audio classification problem [1-3]. Due to its wide spread use for image and audio classification Random Forest algorithm is selected for this analysis. Decision Tree classifier, utilized for different classification problem because of their most effortless training process. In any case, Decision Tree classifier neglects to give an ultimate quantity of desired trees for a problem. Its performance is also delicate for noisy image.
Leo Breiman first time presented the Random Forest or Random Decision Forest as a powerful tree based classifier [17]. Random Forest build a group of decision tree. Each tree votes in favor of finest class utilization by random vectors. Random vectors specified by (v)n ,the random vector comprises of n vectors having the same distribution probabilities however these vectors are independent from each other such as (v)1, (v)2, (v)3 …. (v)n. Case in point that we have n number of trees, then the random vector will likewise have size equivalent to n. The classifier coming about because of the trees prepared on the random vectors is given by: h(x, (v)k ). Where (v)k the random vector of size 1… k and x as input, is the contribution for which every trees cast votes. Let us suppose that we have hn(x) classifiers, where hn(x) is a vector denoting the output of each tree = { h1 (x), h2 (x), h3(x)……. hk(x) }.
MLP: ANN comprises of both unsupervised and supervised variants. Supervised ANN is known as MLP [18]. Unsupervised ANN is called Self-Organizing Map (SOM) [19]. Neural system comprise of three kinds of layers: the first layer which is utilized to handle the input data also called input layer. The input layer is associated with the second layer, which is called hidden layer, is used for processing the data. After that second layer is connected with third layer, which is called output layer. The output layer is used to present the output. In our experiment, the output layer comprises of classifications results: sorghum, cabbage, citrus, damaged sorghum, damaged cabbage and damaged citrus. The Back Propagation technique is used for training of hidden layer in MLP. Back propagation algorithm is used to reduce the error rate. The Perceptron is presented at the input layer, at that stage, layer of output is considered activated. The estimation of the output layer is analyzed and error at this layer is minimized by accompanying following equation: Learning rate "a" decides precision of the framework. If "a" is negative then it implies that output is high and if learning rate is positive then it reflects that output is low. Taking into account the learning rate, the weights are changed in accordance with minimize the error rate “e”.
SVM: SVM makes ideal choice boundary for every class utilizing hyper planes. Initially, SVMs were utilized for direct order issues or particularly two fold characterization like binary classification. For nonlinear classification issues, SVM utilizes nonlinear kernels, for example sigmoid kernels, Radial basis function (RBF) and polynomial. For nonlinear arrangement, the information is changed into higher dimensional space. Where x is the original input and 8 denotes the variance. The kernel we have selected for this experiment is the polynomial kernel as shown. [20]. As mentioned above, the gamma parameter is utilized to manage the scale and ‘d’ is the level of the polynomial. Utilizing the kernel of polynomial, the input data will be characterized as:
![]()
In this test, we utilized the polynomial part, the quality parameter, which is c, is equals to one. Random seed initialized by one and tolerance set to 0.002.
Results
For experimental purpose total of 382 images of cabbage, 539 images of citrus and 262 images of sorghum were used as the primary dataset. The 40% data, 473 samples were utilized for testing and 60%, which consist of 710 samples were used for training which consist of both healthy and damaged leaves as shown in the dataset description section (Fig 1). Different classifiers such as Random forest, SVM and ANN have been used for performance comparison. Performance comparison has been carried out using F1 Score. F1 score can be defined as the mean of both the precision and recall. Whereas, precision is the number of correct results divided by the total number of positive results, while recall is the number of correct positive results divided by the total number of positive results that should have been returned mathematically F1-score can be written as:
F1= 2{(precision X recall)/ (precision + recall)}
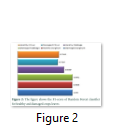
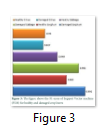
Figure 2 shows the F1-score of Random Forest classifier for different classes, Figure 3 shows the results of SVM classifiers, Figure 4 shows the results obtained for all the classes using ANN classifier while Figure 4 shows the average F1-score reported by these classifiers and comparison between these classifiers using the F1-score. Different classes are labelled as healthy citrus, healthy cabbage, healthy sorghum for healthy plants and damaged sorghum, damaged citrus and damaged cabbage for diseased plants.
Binding affinity analysis of selected compounds through LigX shown in Figure 2 revealed that top ranked molecules experience water mediated binding with the crucial catalytic residues of pocket.
Tables & Figures
Discussion
Referring to the results obtained, as shown in Figure 2, Figure 3, Figure 4 and Figure 5 general conclusion can be drawn on the performance of classifier. Result of individual classifiers, shown in Figure 2, illustrated the performance of Random Forest classifier on the testing dataset. According to Figure 2 best F1 score was achieved for damaged cabbage while the lowest F1 score has been obtained for the damaged citrus plant which is line with previous finding on the same subject [21]. The average F1 score achieved for Random Forest is 0.954; except citrus plant all other plants have achieved F1 score of above 0.95. SVM obtained highest F1-score for damaged sorghum but SVM performance was not satisfactory in identification of damage citrus. This observation was also relevant earlier reports [22]. SVM has also shown satisfactory results for the identification of damage cabbage and healthy sorghum. The MLP showed best results in healthy cabbage, damage cabbage, healthy sorghum, damage sorghum. Somewhat similar results were obtained in another study on wheat [23]. The overall results of Random Forest, MLP and SVM are depicted in Figure 5. The Random Forest performance worked quite well in comparison with other techniques.
From the obtained results in Figure 2, Figure 3 and Figure 4, it can be generalized that these classifiers (Random Forest, SVM, MLP) has high F1-score for cabbage except for MLP which has resulted the highest F1-score for damaged sorghum, the rest of the classifiers i.e., Random Forest and SVM have shown higher accuracy in the classification of damaged cabbage and the lowest accuracy was reported for citrus both healthy and non-healthy citrus. SVM also showed better results in detection of nutritional deficiencies in coffee tree leaves [24]. Based on the average result obtained from the above classification algorithms it can be stated that, supervised machine learning approaches such as SVM, MLP and Random Forest classifiers are best suited for the identification of healthy and non-healthy plants through plant leaf images.
In this paper a near investigation of supervised machine learning classifiers of SVM, MLP and Random Forest has been completed to recognize unhealthy and healthy plants. Color based features provides sufficient clues for visual identification of healthy and diseased segments of plant leaves, but under different illumination conditions color information only is not sufficient to distinguish between the healthy and damage crop. Thus our research combines color based information, statistical information extracted from color such as mean, median, max and HOG. Using these features crops leaves can be distinguished between healthy and non-healthy. Further our research elaborate the importance of non-parametric Random Forest classifier, it has been demonstrated that Random Forest classifier has achieved the maximum F1-score compared to SVM and MLP. In near future, we are attracted to get segmentation of a particular disease in a specific plant. So as to productively recognize specific infection in a plant, a proper cure can be chosen.
References
- Pujari JD, Yakkundimath R, Byadgi AS. Automatic Fungal Disease Detection based on Wavelet Feature Extraction and PCA Analysis in Commercial Crops. International Journal of Image, Graphics and Signal Processing, (2013); 6(1): 24-31.
- Ali K, Rahman HU, Khan R, Siddiqui MY, Najeeb F, et al. Land Usage Analysis: A Machine Learning Approach. International Journal of Computer Applications, (2016); 141(12): 40-45.
- Khan J, Wei JS, Ringner M, Saal LH, Ladanyi M, et al. Classification and diagnostic prediction of cancers using gene expression profiling and artificial neural networks. Nature Medicine, (2001); 7(6): 673.
- Ali K, Rahman HU, Khan R, Siddiqui MY, Najeeb F, et al. Land Usage Analysis: A Machine Learning Approach. International Journal of Computer Applications, (2016); 141(12): 23-28.
- Khoje SA, Bodhe S, Adsul A. Automated Skin Defect Identification System for Fruit Grading Based on Discrete Curvelet Transform. International Journal of Engineering and Technology, (2013); 5(4): 3251-3256.
- Razmjooy N, Mousavi BS, Soleymani F. A real-time mathematical computer method for potato inspection using machine vision. Computers & Mathematics with Applications, (2012); 63(1): 268-279.
- Anami B, Savakar DG. Improved method for identification and classification of foreign bodies mixed food grains image samples. ICGST-AIML Journal, (2009); 9(1): 1-8.
- Landge P, Patil SA, Khot DS, Otari OD, Malavkar U. Automatic detection and classification of plant disease through image processing. International Journal of Advanced Research in Computer Science and Software Engineering, (2013); 3(7): 798-801.
- Dubey SR, Dixit P, Singh N, Gupta JP. Infected fruit part detection using k-means clustering segmentation technique. International Journal of Artificial Intelligence and Interactive Multimedia, (2013); 2(2): 65-72.
- Bauer SD, Korč F, Förstner W. The potential of automatic methods of classification to identify leaf diseases from multispectral images. Precision Agriculture, (2011); 12(3): 361-377.
- Pacheco A, Barón HB, Crespo RG, Espada JP. Reconstruction of High Resolution 3D Objects from Incomplete Images and 3D Information. International Journal of Interactive Multimedia and Artificial Intelligence, (2014); 2(6): 7-16.
- Patil SB, Bodhe SK. Leaf disease severity measurement using image processing. International Journal of Engineering and Technology, (2011); 3(5): 297-301.
- Bandi SR, Varadharajan A, Chinnasamy A. Performance evaluation of various statistical classifiers in detecting the diseased citrus leaves. International Journal of Engineering Science and Technology, (2013); 5(2): 298-307.
- Cui D, Zhang Q, Li M, Hartman GL, Zhao Y. Image processing methods for quantitatively detecting soybean rust from multispectral images. Biosystems Engineering, (2010); 107(3): 186-193.
- Déniz O, Bueno G, Salido J, De la Torre F. Face recognition using histograms of oriented gradients. Pattern Recognition Letters, (2011); 32(12): 1598-1603.
- Lowe DG. Distinctive image features from scale-invariant keypoints. International Journal of Computer Vision, (2004); 60(2): 91-110.
- Breiman L. Random forests. Machine Learning, (2001); 45(1): 5-32.
- Yuan H, Van Der Wiele CF, Khorram S. An automated artificial neural network system for land use/land cover classification from Landsat TM imagery. Remote Sensing, (2009); 1(3): 243-265.
- Babu GP. Self-organizing neural networks for spatial data. Pattern Recognition Letters, (1997); 18(2): 133-142.
- Chang Y-W, Hsieh C-J, Chang K-W, Ringgaard M, Lin C-J. Training and testing low-degree polynomial data mappings via linear SVM. Journal of Machine Learning Research, (2010); 11(Apr): 1471-1490.
- Fletcher RS, Reddy KN. Random forest and leaf multispectral reflectance data to differentiate three soybean varieties from two pigweeds. Computers and Electronics in Agriculture, (2016); 128199-206.
- Alemayehu DM, Mengistu AD, Mengistu SG. Computer vision for Ethiopian agricultural crop pest identification. Indonesian Journal of Electrical Engineering and Computer Science, (2016); 3(1): 209-214.
- Moshou D, Bravo C, West J, Wahlen S, McCartney A, et al. Automatic detection of ‘yellow rust’in wheat using reflectance measurements and neural networks. Computers and electronics in agriculture, (2004); 44(3): 173-188.
- Vassallo-Barco M, Vives-Garnique L, Tuesta-Monteza V, Mejía-Cabrera HI, Toledo RY. Automatic Detection of Nutritional Deficiencies In Coffee Tree Leaves Through Shape And Texture Descriptors. Journal of Digital Information Management, (2017); 15(1): 7-18.
This work is licensed under a Creative Commons Attribution-Non Commercial 4.0 International License. To read the copy of this license please visit: https://creativecommons.org/licenses/by-nc/4.0/


